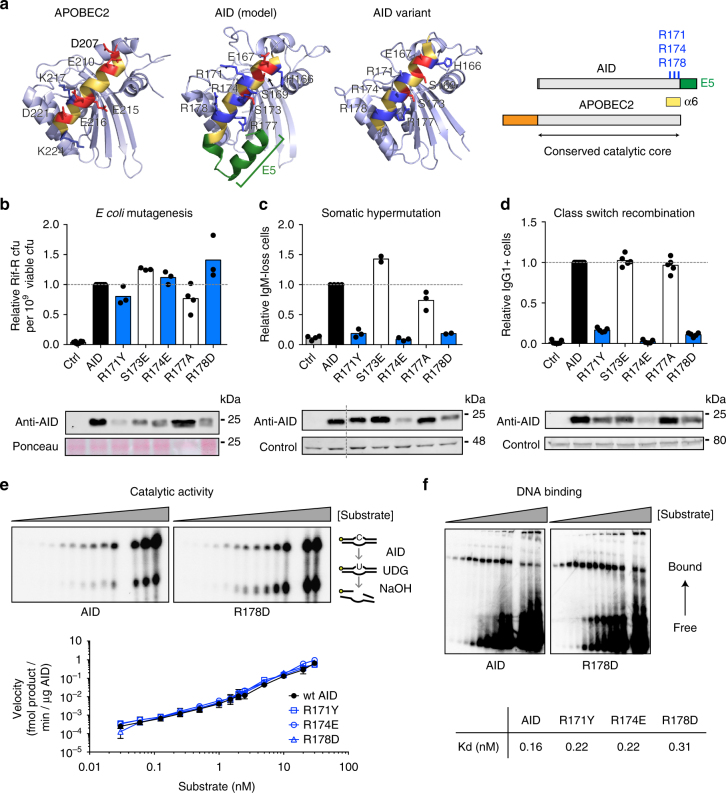
Fig. 1.
Identification of functionally inactive AID variants. a (Left) Comparison of our 3D model of AID to the experimental structure of APOBEC2 (PDB 2NYT) and an AID variant (PDB 5JJ4) in the same orientation. Selected residues within helix α6 are labelled. Side chains for basic (blue) and acidic (red) residues are shown. (Right) Schemes of AID and APOBEC2. b Mutagenic activity in E. coli, measured by the relative frequency of rifampicin-resistant (Rif-R) colony-forming units (cfu) arising from cultures expressing AID variants or empty vector (Ctrl). Means (bars) of median values (dots) obtained from 3 to 8 independent experiments (5 cultures/experiment) per construct are shown, normalized to AID. c Somatic hypermutation activity, assayed by the relative IgM-loss accumulation in cultures of DT40 Aicda−/− ΔΨVλ B cells complemented with AID variants-ires-GFP or empty vector (Ctrl). Means (bars) of the median values (dots) obtained from 2 to 5 independent experiments (12–24 cultures/experiment), each normalized to the median value of AID. d Class switch recombination activity in Aicda−/− mouse primary B cells cultured with LPS and IL-4 and transduced with AID variants-ires-GFP or empty vector (Ctrl). Means (bars) proportion of IgG1+ cells in the GFP+ population at 72 h after transduction for each mouse (dots) from 5 to 7 independent experiments are shown, normalized to AID. In b–d, WB of cell extracts probed with anti-AID antibody and loading control are shown at the bottom. e Catalytic kinetics of purified recombinant wt AID and R-mutants assayed by the standard alkaline cleavage assay for deamination. (Top) Representative assays used to measure specific activity of wt AID and R-mutants. (Bottom) Mean ± s.d. of four independent experiments were quantified. f DNA-binding affinity of wt AID and the R-mutants assayed by EMSA. (Top) Representative EMSA gels are shown. (Bottom) Mean Kd was calculated from four independent experiments for each AID variant. For gel source data, see supplementary Fig. 7

