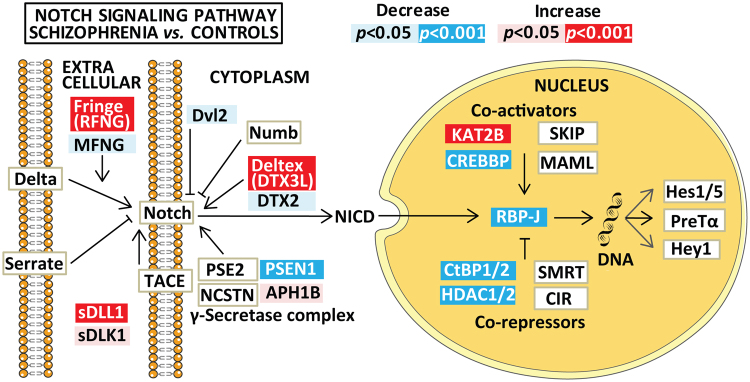
Figure 1.
Summary of significant and nominally significant findings in Notch pathway mRNA expression between the schizophrenia and the healthy control group after controlling for age, gender and Bmal1. Results are given as p-values, adjusted for multiple testing, where significant results are indicated in red/dark blue (for increased/decreased mRNA expression) and nominally significant results (0.001 < p < 0.05) are shown as pink/light blue (for increased/decreased mRNA expression). Non-significant results are depicted as boxes with white background. The figure is based on the Notch signaling pathway in the KEGG database (hsa04330, version date 5/9/17). Hey1 is included by the authors due to its known role as a target gene for Notch signaling30.

