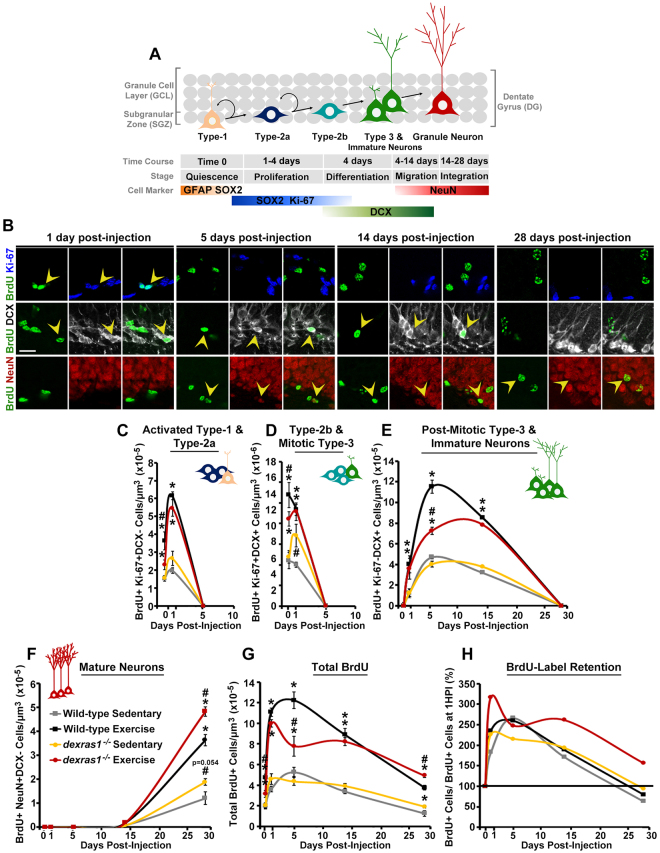
Figure 2.
Dexras1 ablation alters the proliferative and survival properties of progenitor cells in a stage-specific manner. (A) Graphical representation of hippocampal neurogenesis and respective markers used to identify the various stage-specific cell types. (B–H) Wild-type and dexras1−/− mice were injected with a single dose of BrdU on day 5 of sedentary or exercise condition. Tissues were harvested after 1 hr (0 DPI) or after 1, 5, 14 or 28 days-post injection (DPI). (B) Representative photomicrographs showing the BrdU label (green) in cells positive for Ki-67 (blue), DCX (white) or NeuN (red) at 1, 5, 14 or 28 DPI. Yellow arrowheads indicate cells with co-localized expression. Images are represented as a single z-stack image (5-μm) acquired at 40× magnification. Scale bar = 20 μm. (C–G) Quantification of the density of BrdU-labeled (C) Ki-67+DCX− activated type-1 and type-2a cells, (D) Ki-67+DCX+ type-2b and mitotic type-3 cells, (E) Ki-67−DCX+ post-mitotic type-3 cells and immature neurons, and (F) NeuN+DCX- mature neurons. (G) Quantification of the density of all BrdU-labeled cells. X-axis indicates the number of DPI. Data are represented as mean number of cells per μm3 of tissue (x10−6 or x10−5) ± standard error. (H) Percent of BrdU-label retention. Percentage values are calculated as the number BrdU+ cells at each DPI divided by the number of BrdU+ cells at 1 hr post-injection (1 HPI). Wild-type sedentary (grey); wild-type exercise (black); dexras1−/−sedentary (yellow); dexras1−/−exercise (red). *p < 0.05 vs. sedentary control. #p < 0.05 vs. wild-type control. n = 4–6 per group. Refer to Table S1 for cell counts.

