Figure 3.
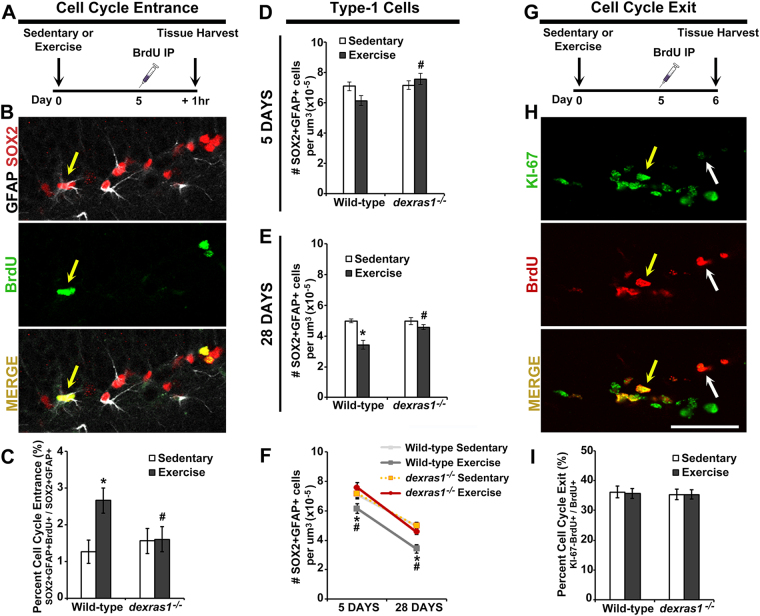
Dexras1 is required for exercise-mediated recruitment of type-1 cells into the cell cycle. (A) BrdU-injection paradigm for cell cycle entrance. Wild-type and dexras1−/− mice were placed under sedentary or exercise condition, injected once with BrdU on day 5, and killed for tissue after 1 hr post-injection. (B) Representative photomicrographs of BrdU-labeled (green) cells that co-express GFAP (white) and SOX2 (red). (C) Percent of type-1 cells that recently entered the cell cycle. Values are calculated by dividing the number of BrdU+GFAP+SOX2+ cells by the total number of GFAP+SOX2+ cells in the SGZ. (D–F) Quantification of the number of SOX2+GFAP+ cells per μm3 of SGZ (x10−5) after (D) 5 days or (E) 28 days of sedentary or exercise condition. (F) shows the combined data of both time points. (G) BrdU-injection paradigm for cell cycle exit. Wild-type and dexras1−/− mice were injected once with BrdU on day 5 of sedentary or exercise conditions, and killed for tissue after 24 hr post-injection. (H) Representative photomicrographs of BrdU-labeled (red) cells that co-express Ki-67 (green). (I) Percent of proliferating cells that have exited the cell cycle after 24 hr. Values are calculated by dividing the number of BrdU+Ki-67− cells by the total number of BrdU+ cells in the SGZ. All values represent mean ± standard error. *p < 0.05 vs. sedentary control. #p < 0.05 vs. wild-type control. n = 5–6 per group. Yellow arrows indicate cells with co-localized expression; white arrow shows a BrdU+Ki-67− cell. Images are represented as a single z-stack image (5-μm) acquired at 40× magnification. Scale bar = 50 μm.

