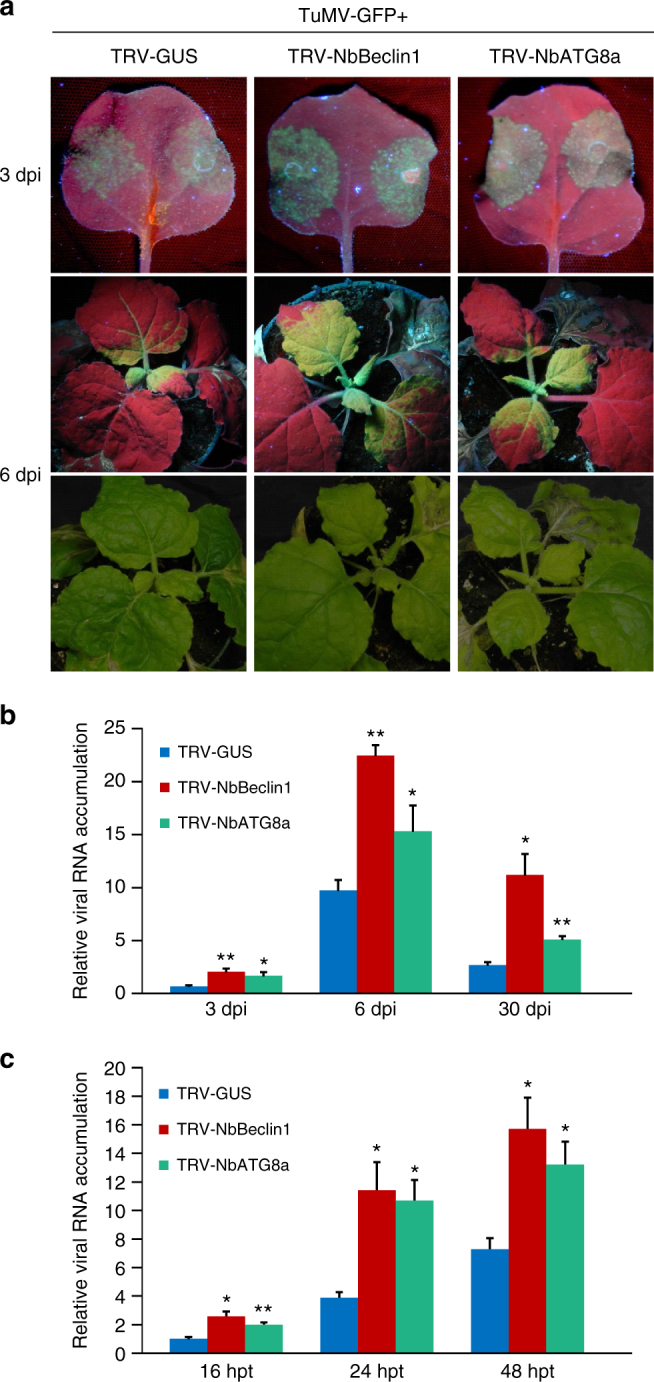
Fig. 8.

Silencing of NbBeclin1 or NbATG8a promotes TuMV infection in N. benthamiana. a GFP fluorescence and viral symptoms in plants pre-inoculated with TRV1 together with TRV2-GUS (control), TRV2-NbBeclin1, or TRV2-NbATG8a for 7 days and then infected by TuMV-GFP. Plants were photographed under UV light at 3 and 6 dpi and under regular light at 6 dpi. b Quantification of TuMV genomic RNA in the above plants. RNA was extracted from TuMV-GFP-inoculated leaves at 3 dpi or systemically infected leaves at 6 dpi and 30 dpi. The values are presented as means of fold change ±SD relative to the control plants (pretreated with TVR1 and TRV2-GUS). Error bars represent SD. Three independent experiments, each consisting of three biological replicates, were carried out. Values from one representative result were used to plot a histogram and were normalized against NbActin transcripts in the same sample. The data were analyzed using Student’s t-test (two-sided, *P < 0.05, **P < 0.01). c Protoplast transfection assay. Protoplasts isolated from N. benthamiana plants pre-inoculated with TRV1 together with TRV2-GUS, TRV2-NbBeclin1, or TRV2-NbATG8a were transfected with TuMV-GFP. RNA was extracted at 16, 24, and 48 hpt and quantified by qRT-PCR to analyze TuMV genomic RNA accumulations. Values are presented as means ± SD, and error bars represent SD (n = 3 biological replicates). The data were analyzed using Student’s t-test and asterisks denote significant differences compared to the TuMV-infected protoplasts from control plants pre-treated with TRV1 and TRV-GUS (two-sided, *P < 0.05, **P < 0.01)
