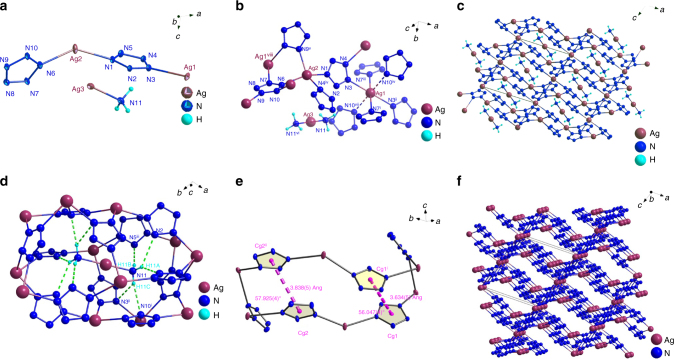
Fig. 3.
Crystal structure of [Ag(NH3)2]+[Ag3(N5)4]ˉ. a ORTEP plot of [Ag(NH3)2]+[Ag3(N5)4]ˉ at the 50% probability level. b The coordinate diagram of [Ag(NH3)2]+[Ag3(N5)4]ˉ. c Unit cell view along the b axis. d Schematic representation of the hydrogen-bonded motifs in the crystal structure: H-bonds are indicated as dotted lines. e π–π stacking interaction in the crystal structure (Cg1 and Cg2 were the centers of cyclo-N5ˉ). f The 3D framework of [Ag(NH3)2]+[Ag3(N5)4]ˉ

