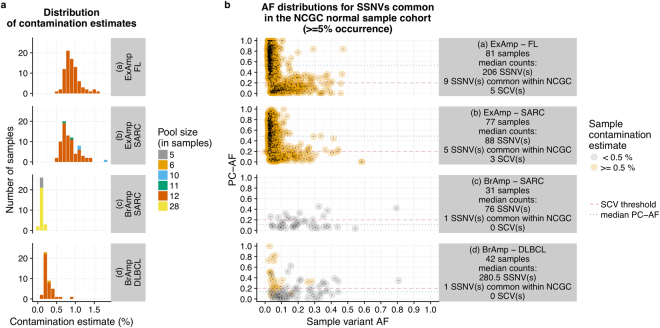
Figure 2.
Amplification chemistry and its relationships to (a) sample contamination estimates and (b) variant counts and PC-AF values. All values are plotted separately for each combination of tumour type and amplification chemistry represented in the analysis. The colours distinguish between variants called in “high-contamination” samples (Conpair contamination estimate > = 0.5%) and variants coming from samples with “low contamination” (Conpair contamination estimate < 0.5%). BrAmp: bridge amplification; FL: follicular lymphoma; SARC: sarcoma; DLBCL: diffuse large B-cell lymphoma; SCV: suspected contaminant variant.

