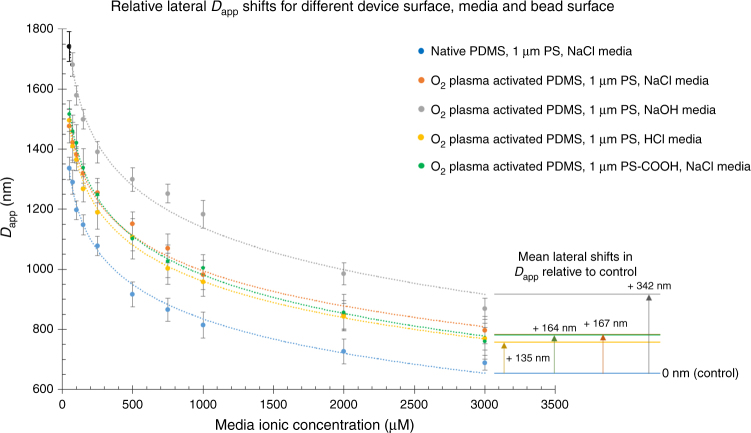
Fig. 3.
Parameters governing surface charge influence on the lateral Dapp shift. Plot of the relative lateral Dapp shift for different device surface, bead surface, and buffer media at different ionic concentrations. The shift is calculated relative to native PDMS control. A positive shift would mean an increase in Dapp across all ionic concentration levels. Each data point was plotted based on at least 50 sample counts and the error bar represent the SD of the sample Dapp

