Fig. 4.
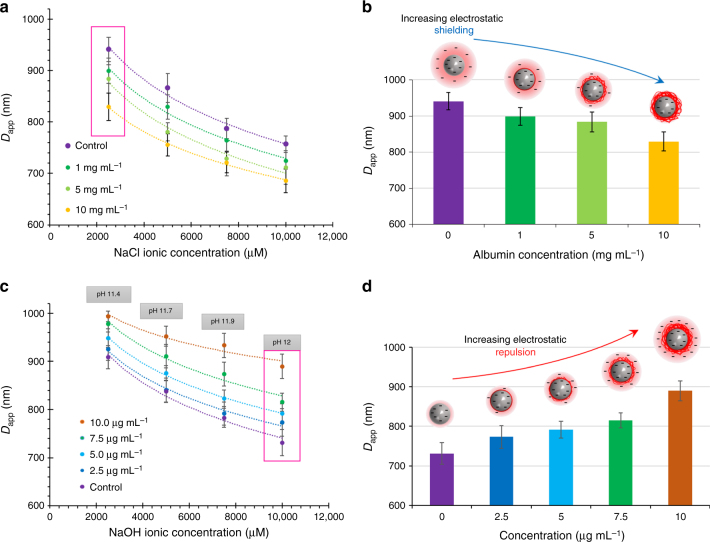
Optimizing albumin concentration detection range and electrostatic interactions. a Shows detection of proteins in the mg mL−1 range using varying NaCl concentrations as the media. The greatest difference in mean lateral Dapp shifts is highlighted in the magenta box and shown in b where increasing protein concentration shields the surface charges on the beads. c Using NaOH alkaline solution, detection of proteins within the µg ml −1 range was performed and the greatest difference of the mean lateral shifts is shown in pH 12 NaOH media (within the magenta box). d Shows the Dapp of different coated beads in a NaOH pH 12 media. All data point comprises of the distribution of at least 50 beads with the error bar representing the SD of the calculated Dapp

