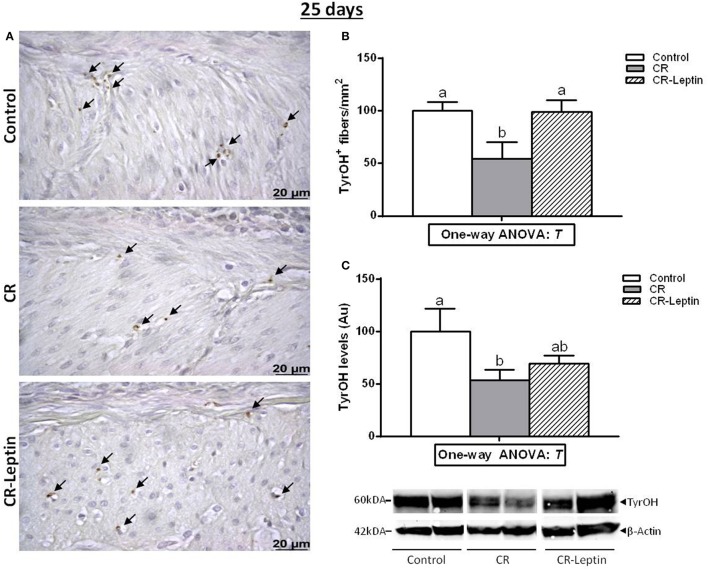
Figure 1.
Immunohistochemical analysis of TyrOH positive (TyrOH+) fibers and western blot determination of specific TyrOH protein in the stomach of control, CR and CR-Leptin animals at the age of 25 days. (A) Representative immunostained sections for TyrOH (brown color), indicated by black head arrows in the muscular layer area. Scale bar: 20 μm. (B) Number of TyrOH+ (fibers/mm2 of stomach). (C) Specific protein levels of TyrOH in the stomach expressed relative to levels of β-Actin (loading control). Representative bands for TyrOH and β-Actin are shown. They have been cut from the same membrane and grouped together in the image. 150 ug of protein were loaded in each lane. Results are expressed as mean ± s.e.m. (n = 10–11). Symbols: T, effect of early treatment (C, CR, and CR-Leptin) (P < 0.05, one-way ANOVA). Symbols: a ≠ b.

