Figure 2.
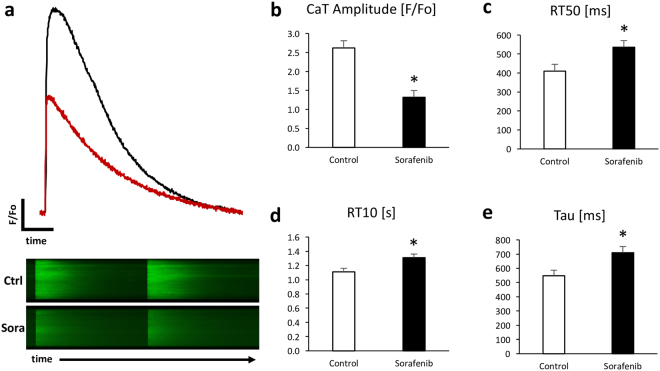
Reduced calcium transient amplitude and slowed calcium re-uptake in sorafenib (10 µM) treated murine ventricular cardiomyocytes. Representative calcium transients (above) and original 2D calcium wave line-scan (below) (a) and summary data for calcium transient amplitude (b), time to 50 and 90% (RT10) decay of calcium transient signal (c,d), and relaxation constant Tau (e). n = 17 cells/10 hearts, *p < 0.001 for treatment/time interaction and p < 0.05 vs. control by 2-way mixed ANOVA with Welch’s post hoc t-test.

