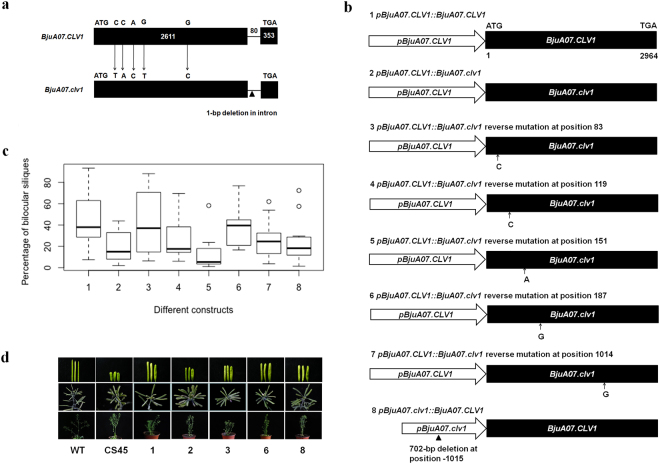
Figure 4.
Identification of the sequence variations causing the changes of carpel numbers. (a) Gene structure of BjuA07.CLV1 from Tayou2 and BjuA07.clv1 from Duoshi in B. juncea. Black boxes represent the exons, and the black lines the introns. The initiation codon (ATG) and stop codon (TAG) are shown in the figure. The numbers in the black box and above the black linerepresent the nucleotides of the exons and intron, respectively. The arrows indicate five single nucleotide substitutions, resulting in amino acid changes. The individual black triangle represents deletion. (b) The schematic representation of the constructs synthesized by GENEWIZ Inc. (China), which was introduced to pCAMBIA2300, and then transformed the Arabidopsis mutant CS45. The white arrow represents the promoter, pBjuA07.CLV1 and pBjuA07.clv1 in it represents the promoter of the BjuA07.CLV and BjuA07.clv1 gene. The black box represents CDS region, BjuA07.CLV1 and BjuA07.clv1 in it represents the different CDS from the BjuA07.CLV and BjuA07.clv1 gene. The small black arrow and the nucleotide below represent the substitution position and the introduced base. The individual black triangle represents deletion. (c) Percentage of bilocular silique. The constructs of 1–8 is same as that in (b) of Fig. 4. (d) The T1 phenotype obtained in the genetic complementation test. The rows from top to bottom show the obtained phenotype of siliques, branch and the individual plant. The constructs used in the lines from left to right are 1, 2, 3, 6 and 8, respectively, which are same as that in (b) of Fig. 4.

