Figure 5.
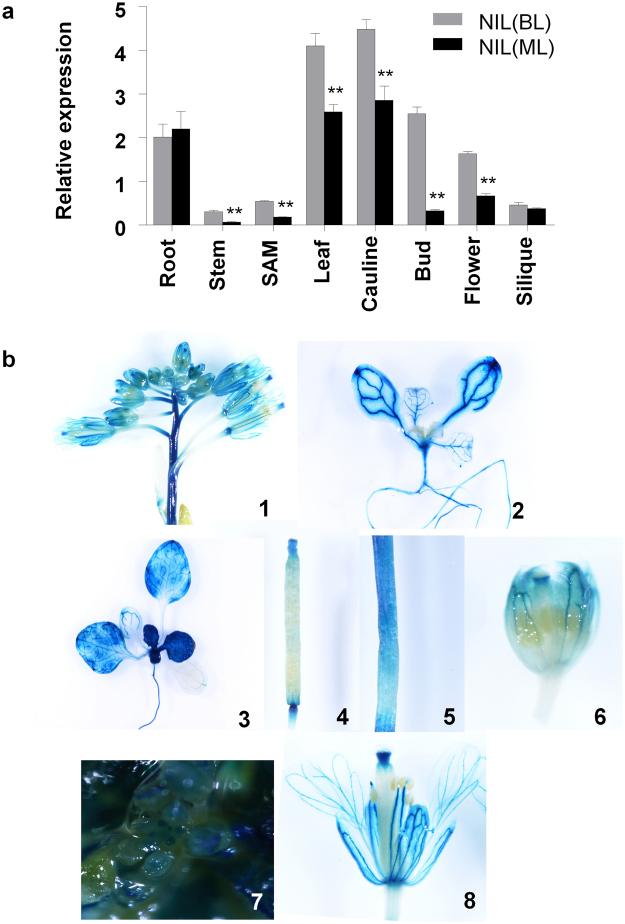
Expression pattern analysis of BjuA07.CLV1 between bilocular and multilocular plants of near isogenic line using real time quantitative polymerase chain reaction (RT-qPCR) and β-glucuronidase (GUS) assay. (a) Comparison of BjuA07.CLV1 expression between NIL (BL) and NIL (ML) in various tissues by using qRT-PCR. The reference gene is β-actin. The values are the averages of three biological replicates; SDs are shown as error bars. **P < 0.01, and *P < 0.05. (b) GUS expression patterns (blue staining) in different tissues from the ProBjuA07.CLV1-GUS transgenic line; With the exception of siliques (4), GUS staining was detected in all tested tissues, including inflorescence (1), cotyledon (2), seedling (3), root (2,3), stem (5), bud (6), SAM (7) and flower (8).

