Figure 1.

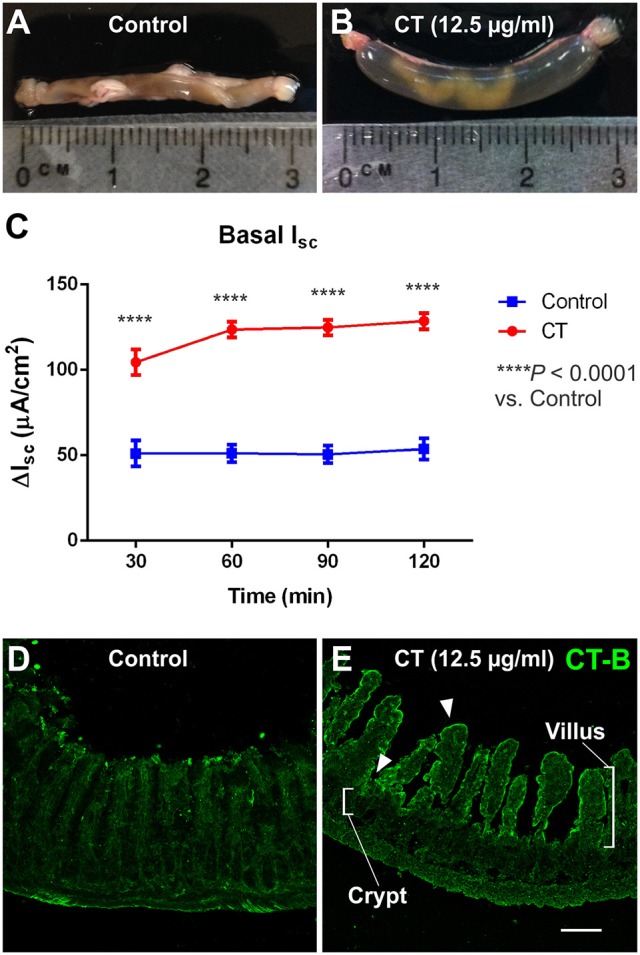
CT-treated vs. control ileal loops following 3.5 h incubation in vivo. Images of ileal loops after a 3.5 h incubation in vivo with saline (control, A), or CT (12.5 μg/ml, B) in saline. CT-treated loops displayed substantial accumulation of fluid that was absent in controls. Accordingly, basal ISC measured in full thickness ileal tissues and monitored for 120 min following CT-incubation (n = 11) was significantly higher than that of saline controls (n = 10; two-way ANOVA with Bonferroni's post-test, ****P < 0.0001) (C). Confocal micrographs of cryosections from control (D) and CT-treated ileal loops (E) fluorescently labeled for CT-B. CT-B staining was specifically observed in CT-treated tissues and was confined to the mucosal epithelium. CT-B-immunoreactivity was observed predominantly in the villi, but also close to the crypts, as indicated by arrowheads. Scale bar = 100 μm.
