Figure 5.
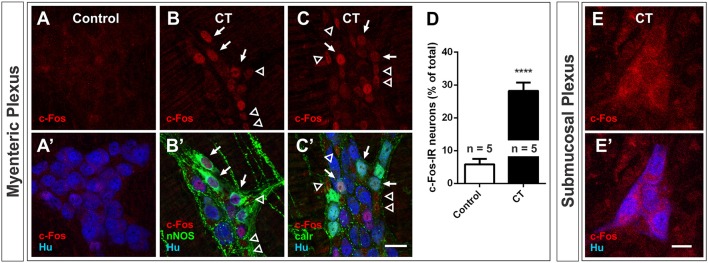
Nuclear c-Fos expression in the myenteric plexus increased following CT-incubation. Confocal images of myenteric ganglia from a control (A,A′) and a CT-treated ileal loop (B–C′), labeled for c-Fos (red) and the neuronal marker Hu (blue). Some CT-treated preparations were co-labeled with neuronal nitric oxide synthase (nNOS, B′) and some were co-labeled with calretinin (calr, C′). Arrows indicate Hu+ neurons displaying nuclear c-Fos labeling and nNOS or calretinin expression. Empty arrowheads mark possible glial (Hu−) nuclei displaying c-Fos expression. (D) A significantly higher proportion of myenteric neurons (Hu+) displayed nuclear c-Fos labeling after CT-treatment compared to controls (****P < 0.0001; n = no. of animals examined). (E,E′) We did not observe any nuclear cfos labeling in submucosal ganglia. Scale bars = 20 μm.

