Figure 6.
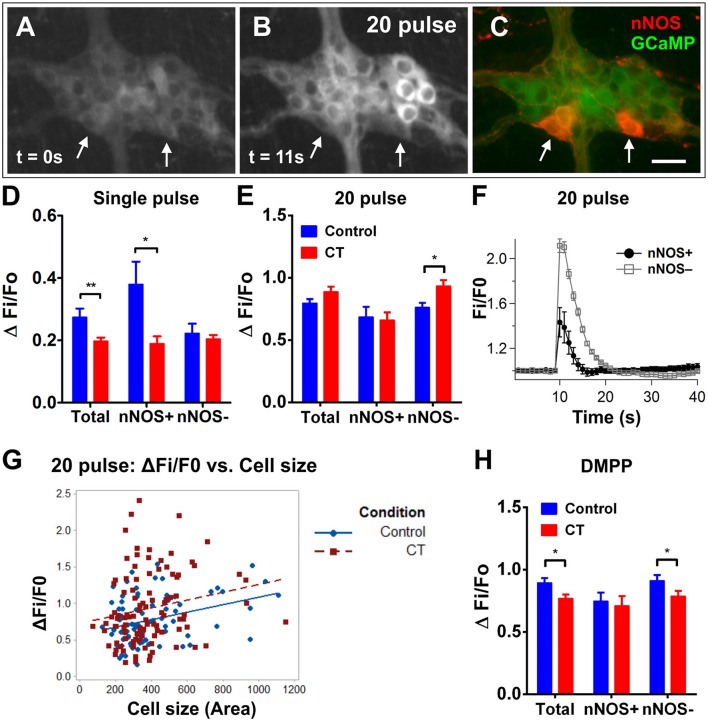
Electrically- and DMPP-evoked [Ca2+]i responses in myenteric neurons are decreased following CT-exposure. (A–C) A myenteric ganglion from a CT-incubated preparation responding to a train of stimuli (20 pulse). Cholinergic neurons were identified with post-hoc labeling for nNOS (neuronal nitric oxide synthase; red, C). Arrows indicate the nNOS+ neurons that responded. Scale bar = 20 μm. In each histogram (D,E,H) the amplitude (ΔFi/F0) of “Total” neurons that responded was presented (left) then divided into those of nNOS− (middle) and nNOS+ (right) groups. (D) Single pulse stimuli also evoked smaller amplitude responses after CT-incubation (**P < 0.01; control: n = 62 neurons, CT: n = 84 neurons) and this was specifically observed in nNOS+ neurons (*P < 0.05). (E) Overall responses to 20 pulse stimulation were not different after CT-exposure (control: n = 131 neurons, CT: n = 112 neurons). However, a slight but significant increase (P < 0.05) was observed in nNOS− neurons. (F) Averaged traces of responses to 20 pulse stimulation (applied at 10 s) in nNOS+ (black trace) vs. nNOS− neurons (gray trace; mean ± SEM) from a CT-treated preparation, as depicted in (A–C). (G) The size (area) of nNOS− neuronal cell bodies were plotted against corresponding 20 pulse stimulated response amplitudes to examine if select populations of nNOS− neurons may be differentially affected by CT treatment. Multiple linear regression analysis showed no significant differences in the correlation between cell size and response amplitudes in control vs. CT conditions (control: n = 80 nNOS− neurons examined; CT: n = 101 nNOS− neurons examined). (H) Overall DMPP (10 μM) response amplitudes were significantly smaller after CT-treatment (control: n = 146 neurons, CT: n = 152 neurons), in particular nNOS− myenteric neurons were significantly decreased (*P < 0.05).

