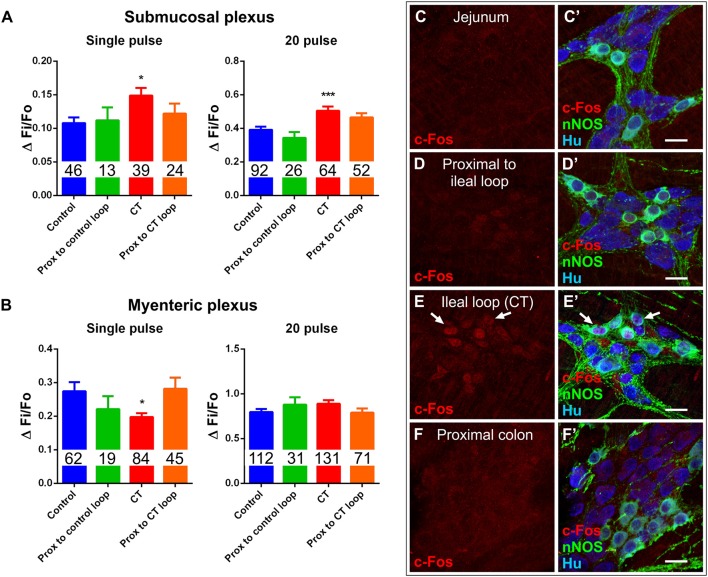
Figure 8.
Effects of CT-exposure were confined to the ileal loop. (A) [Ca2+]i responses of submucosal neurons to electrical stimulation (single pulse and 20 pulse) in segments of ileum proximal to the control loop or proximal to the CT-treated loop did not differ from controls (*P < 0.05, ***P < 0.0001 vs. control). (B) Response amplitudes (ΔFi/F0) of myenteric neurons to electrical stimulation (single pulse and 20 pulse) in segments of ileum proximal to the control loop or proximal to the CT-treated loop also did not differ from controls (*P < 0.05 vs. control). Number of neurons examined are displayed within the bars. Confocal images of myenteric ganglia from jejunum (C,C′), a segment proximal to the ileal loop (D,D′), proximal colon (F,F′), and the CT-treated ileal loop (E,E′), labeled for c-Fos (red), nNOS (green), and the neuronal marker Hu (blue). Arrows indicate neurons (Hu+) displaying colocalization of c-Fos- and nNOS-immunoreactivity. Nuclear c-Fos labeling was confined to the CT-treated ileal loop and was not observed in other intestinal regions. Scale bars = 20 μm.

