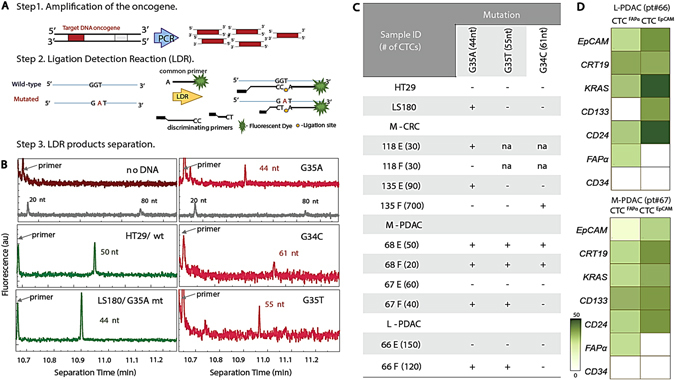
Fig. 5.

KRAS mutation detection. a Schematic of the polymerase chain reaction/ligase detection reaction (PCR/LDR) assay. b Electropherograms of LDR products for: No gDNA; HT29 wt35 (50 nt); LS180 G35A (44 nt); M-PDAC CTCFAPα G35A (44 nt), CTCEpCAM G34C (61 nt); and CTCFAPα G35T (55 nt). The gray trace shows the DNA markers. The fluorescence intensity values are arbitrary. c Table summarizing PCR/LDR results for HT29 and LS180 cell lines, M-CRC, L-CRC, M-PDAC, and L-PDAC CTCs. d RT-qPCR gene expression profiles for L-PDAC patient #66 and M-PDAC patient #67
