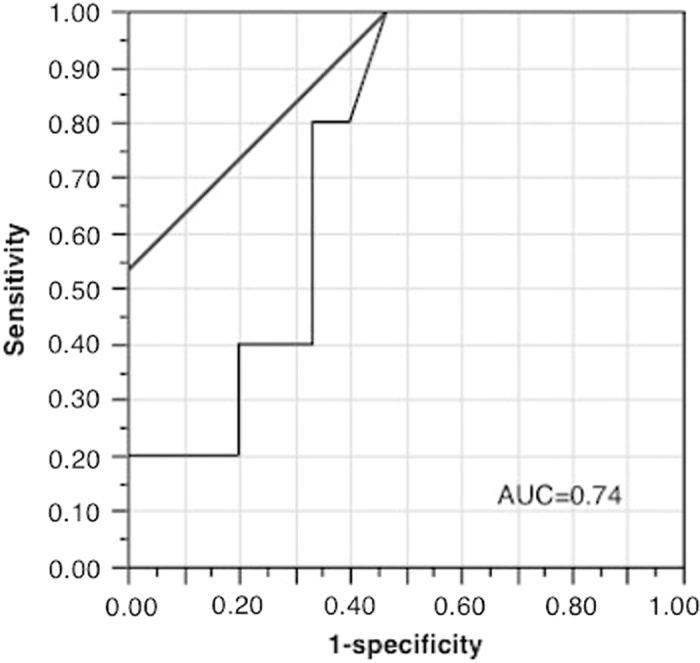
Fig. 5.

Receiver operating characteristic (ROC) curve for pCR to determine the CEP increase cut-off. The x-axis indicates 1-specificity, and the y-axis indicates sensitivity. The area under the ROC curve was 0.74. It gave the CEP increase cut-off as 15 cells (AUC = 0.74)
