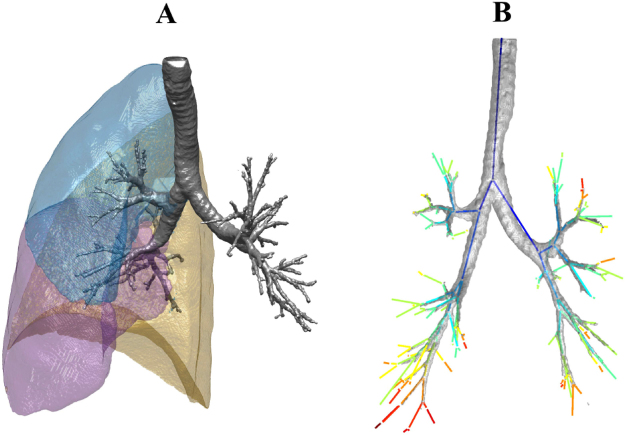
Figure 4.
MSCT analysis. (A) The Apollo software (Vida Diagnostics, Iowa, USA) was used to segment the lobes from the MSCT scans. The resulting contour of the right lung lobes is presented here using custom software written in Matlab (R2015b, MathWorks, Natick, MA 01760–2098, US). (B) Illustration of the extracted branch center lines, along with the segmented airway tree for one of the participants. The center lines are colored according to generation number. Note that for the purposes of illustration, the center lines are plotted between the branch points only. For all of the analysis described in this paper, the complete center line information was used, which captured the true shape of the airways as in Fig. 8.

