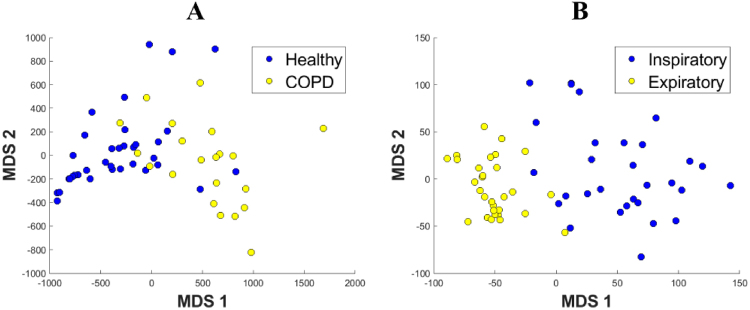
Figure 5.
Spatial representation of similarities between lungs. These are obtained by describing the shape of each lung through a set of topological characteristics called barcodes (see Methods for details) and computing distances between the barcodes of individual subjects. The resulting space is represented in 2D through an MDS embedding. In the legends, Healthy = healthy smokers and non-smokers, COPD = mild and moderate COPD patients. (A) This representation uses degree-2 persistent homology of inspiratory data to infer the shape of the airways inside the cavity of the lobes and it shows a clear distinction between Healthy and COPD groups. The overlap between the groups suggests that our characteristics are on a continuous spectrum. The presence of two nominally healthy cases so deep in the COPD region suggests a potential undiagnosed problem. Interestingly enough, those two individuals were healthy smokers. Similarly, all 6 COPD points which lie in or just outside the healthy region correspond to mild COPD patients. (B) This representation takes into account how the airways bend upwards and shows that this topological feature clearly separates the inspiratory and expiratory stages of the bronchial tree. This analysis was not performed for the expiratory phase because the information about the lobe structure was not available.

