Figure 2.
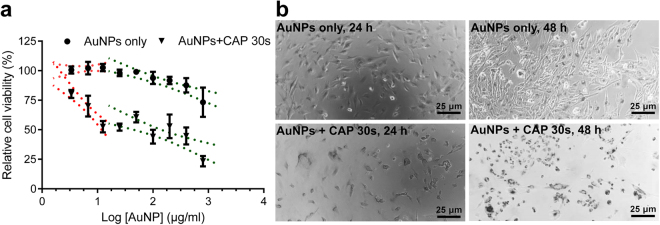
Cytotoxic synergy observed between CAP and AuNP. (a) U373MG cells were treated with different concentrations of AuNPs (0–800 μg/ml). After incubation for 48 h, cell viability was analysed using the Alamar Blue assay. The cell viabilities were divided into two phases (red and green) and non-linear regression was carried out. The 95% confidence bands are displayed using dotted lines. Significant differences in the slope (p < 0.05) are evident using non-toxic AuNP concentrations (0–12.5 μg/ml) which was further confirmed using Pearson’s Correlation test (p < 0.05). All experiments were repeated in five replicates. (b) After CAP treatment (75 kV, 0, 30 s) U373MG cells were incubated with 100 μg/ml AuNPs for 24 h, 48 h, then observed under optical microscope.

