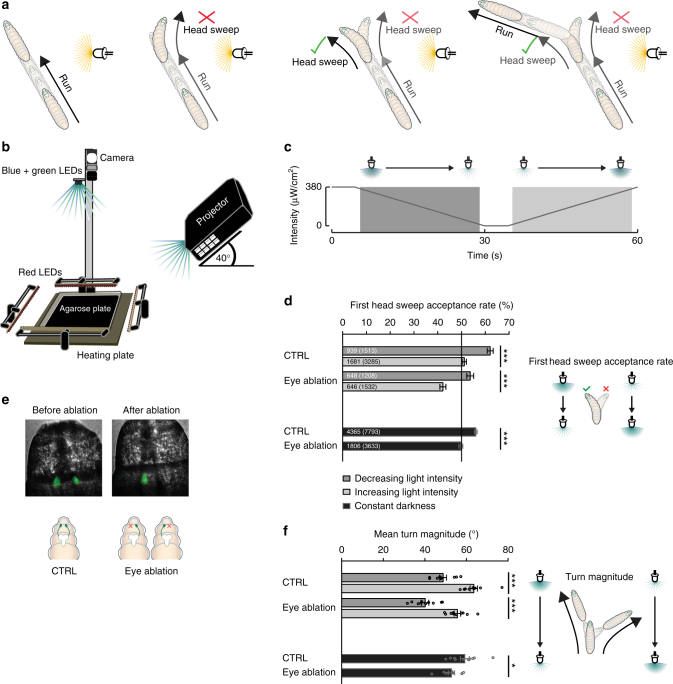
Fig. 1.
Larval navigation. a Schematics demonstrate basic principles of larval navigation. A larva stops its run and probe the environment by head sweeping. A rejected head sweep is followed by another head sweep. An accepted head sweep is followed by a run in this new direction. b Schematic drawing of the behavioral setup. Approximately 30 larvae moved freely on an agarose plate. The temperature of the agarose plate was controlled by a heating plate. The testing plate was illuminated by red LEDs. A camera recorded larval behavior. Larvae were stimulated with a projector from one side or with LEDs from top. c In experiments where a temporal changing light stimulus was presented, the light intensity was decreasing linearly from 380 to 0 µW/cm2 for 25.5 s and increasing linearly from 0 to 380 µW/cm2 with the same speed. These phases were spaced by 4.5 s constant high or low light intensity. The phases of constant light intensity ±1 s were not taken into consideration for analysis. We analyzed behavior occurring in time phase of linear intensity decrease (dark gray) and linear intensity increase (light gray), respectively. d More head sweeps are accepted during the phases of light intensity decrease compared with phases of light intensity increase. One eye is sufficient for this behavioral bias. Fisher’s exact test with n = number of first head sweeps: CTRL: n = 4798, p = 1.7 × 10⁻¹²; eye ablation: n = 2740, p = 2.8 × 10⁻⁹. In darkness one-eyed larvae accepted less head sweeps compared to control animals. Fisher’s exact test with n = number of first head sweeps: CTRL (darkness) vs eye ablation (darkness): n = 11426, p = 3.6 × 10⁻¹⁰. e We created unilateral seeing larvae by the use of an ablation laser. Bolwig organs are marked in green by expression of green fluorescent protein. f During phases of light intensity increase the magnitude of turns was greater than the phase of light intensity decrease. One eye was sufficient for this navigational parameter. Two sample t-test with n = numbers of experiments: CTRL: n = 10, p = 3.4 × 10⁻⁶; eye ablation: n = 10, p = 3.4 × 10⁻⁶. One-eyed animals made smaller turns in comparison with control larvae in constant darkness. Two sample t-test with n = numbers of experiments: CTRL (darkness) vs eye ablation (darkness): n = 20, p = 0.024. d, f Benjamini Hochberg procedure was used to adjust p-values for multiple testing. *p < 0.05, ***p < 0.001. Exact F-values, t-values and degrees of freedom can be found in Supplementary Table 1. The data show mean and error bars show SEM. SEM of binary choice data was calculated with the formula (1). d The first number is the number of accepted first head sweeps and the number in brackets is the total number of first head sweeps for the two phases, respectively. f Circles indicate mean of individual experiments

