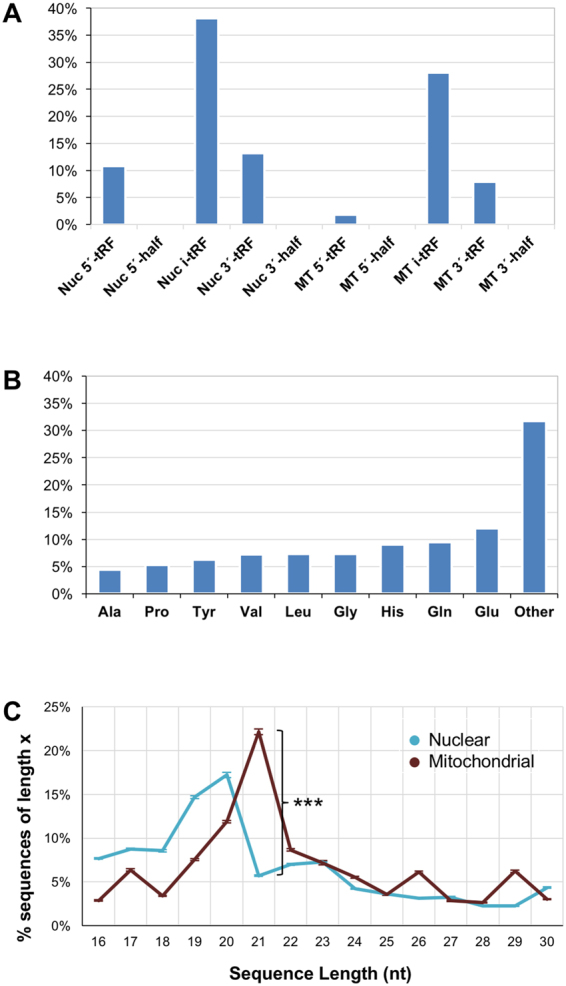
Figure 2.

Classification of tRFs by isodecoder and genome of origin. (A) Percentage of tRFs that map to a specific structural category (nuclearly- and MT-derived tRFs are shown separately). (B) Percentage of tRFs that arise from isodecoders of specific amino acids. (C) Distribution of tRFs as a function of length (nuclearly- and MT-derived tRFs are shown separately). The whiskers represent standard error of the mean across samples. Nuc: nuclear. MT: mitochondrial.
