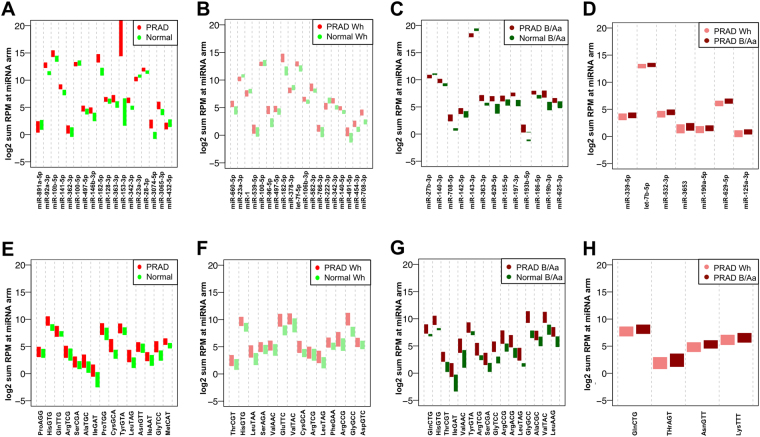
Figure 5.
Comparison of total RPM at miRNA arms and mature tRNA loci. Separately for each sample, we summed the RPM values of each isomiR that arises from a specific locus and assigned the resulting value to that locus. There were 628 loci that produced isomiRs in various combinations in the 526 samples. At most 20 of the miRNA-arms exhibiting differential abundances are shown in each case, if available. (A) PRAD vs. normal (all patients). (B) PRAD vs. normal (Wh patients only). (C) PRAD vs. normal (B/Aa patients only). (D) PRAD from Wh patients vs. PRAD from B/Aa patients. (E–H) counterpart plots to (A–D) for isoacceptors. Analogously, we summed the RPM values of each tRF that arises from a given isoacceptor, and assigned the resulting value to the isoacceptor. There were 47 isoacceptors that produce tRFs in various combinations in the 526 samples. At most 20 of the isoacceptors exhibiting differential abundances are shown in each case, if available.

