Fig. 1.
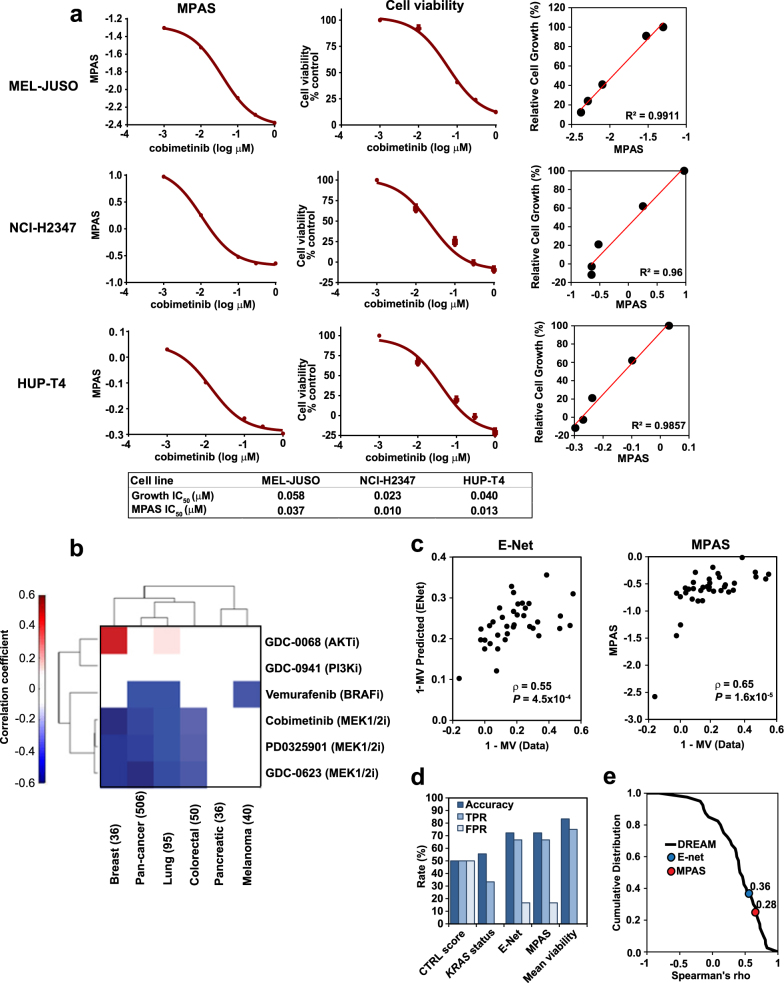
Aggregated gene expression data from a set of 10 MAPK-specific genes predicts MEK inhibitor sensitivity. a MPAS and corresponding cell viability data (relative to vehicle (DMSO) control on day of treatment) in response to 0–10 μM cobimetinib treatment for 72 h in melanoma (MEL-JUSO), NSCLC (NCI-H2347), and pancreatic (HUP-T4) cell lines. Error bars represent standard deviation across triplicate samples. Correlations of MPAS vs. relative cell growth for each cell line are also shown. b Rank correlation coefficients (filtered for P < 0.05) between MPAS and sensitivity (mean viabilities) to MAPK and PI3K signaling pathway inhibitors across cell lines from breast (BRCA) (n = 36), lung (n = 95), CRC (colorectal) (n = 50), melanoma (n = 40), pancreatic (n = 36), and all indications (pan-cancer) (n = 506). c E-Net model-based prediction of cobimetinib sensitivity (1-MV Predicted) for 40 independent NSCLC cell lines vs. the actual mean viabilities (1-MV Data) for the same cell lines treated with 0–10 μM cobimetinib for 72 h. MPAS vs. actual cobimetinib sensitivity (1-MV Data) for the same cell lines treated with 0–10 μM cobimetinib for 72 h. d 40 NSCLC cell lines were categorized as either “sensitive” IC50 < 1 μM or “resistant” IC50 > 1 μM to cobimetinib. True positive (TPR, TPR = TP/(TP + FN)), false positive rate (FPR = FP/(FP + TN)), and accuracy (ACC = (TP + TN)/N) were computed using median-based classification of the E-Net predictions and MPAS and compared to CTRL score (house-keeping gene expression), KRAS mutation status, and mean viability. e The cumulative distribution of Spearman correlation coefficients for 45 team’s predictions of MEK1/2 inhibitor (PD184352) sensitivity from the DREAM consortium Drug Sensitivity Challenge, compared to the performance of the elastic net model, (ρ = 0.55) mapping to the 36th percentile, and the MAPK score (ρ = 0.65), to the 28th percentile

