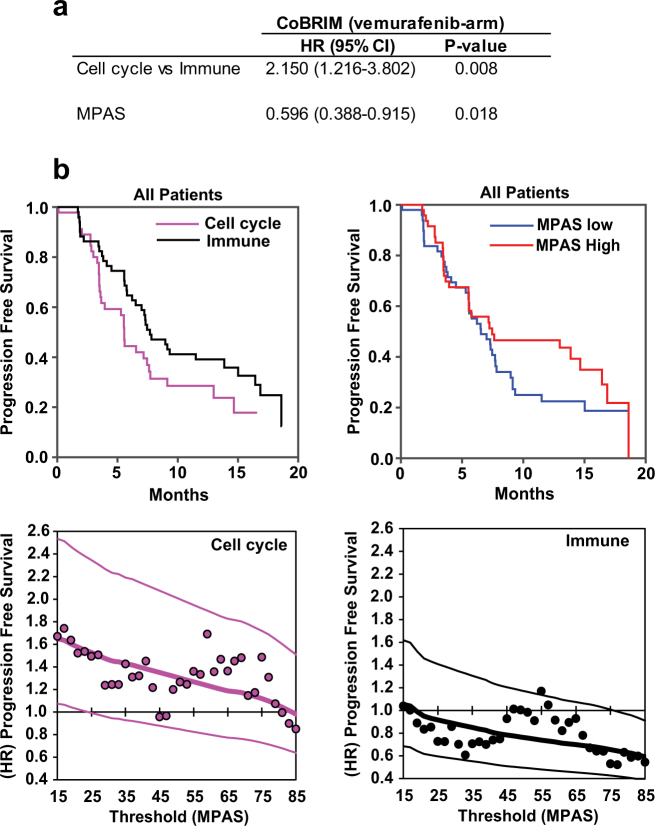
Fig. 3.
MPAS correlates with response to vemurafenib in BRAF-mutant melanoma. a Multivariate Cox proportional hazard regression model parameterized using both “cell cycle” and “immune” tumor subtypes and MPAS for tumors from melanoma patients treated with vemurafenib in the control arm of the CoBRIM clinical trial. Hazard ratios (HRs), 95% confidence intervals, and associated P-values associated with each feature are shown. b Kaplan–Meier curves for progression-free survival (PFS) were plotted according to cell cycle vs. immune or MAPK-high vs. -low median classification for patients enrolled in the vemurafenib arm of coBRIM (median MPAS = 0.08). KM scans of the relative HR as a function of MPAS, using a 15-percentile sliding window for both cell cycle and immune are also shown. Lines represent model-predicted HRs and 95% confidence intervals (compared to all patients), and dots are the HRs computed from the data at individual points

