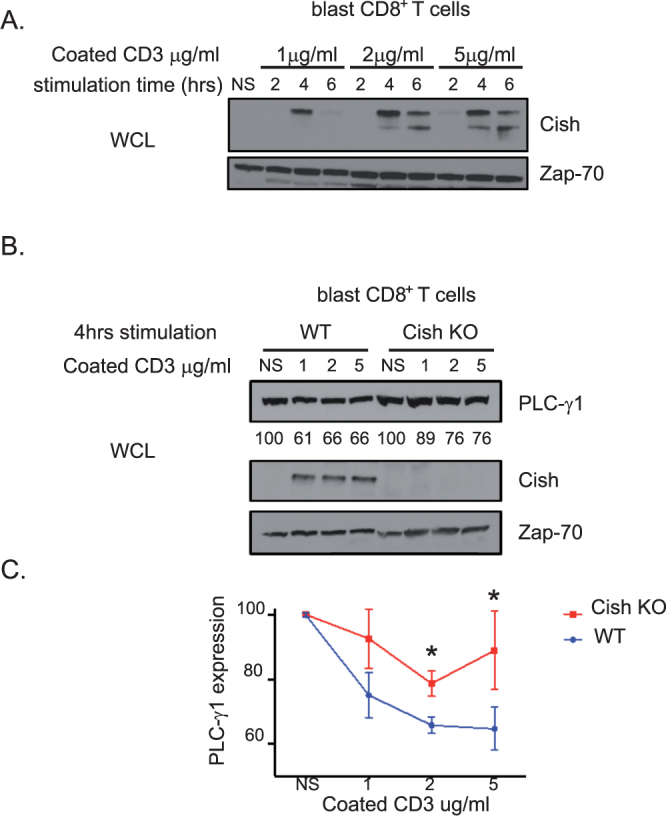
Figure 1.

(A) and (B) Blast T cells from the indicated mice were stimulated with increasing concentration of anti-CD3 coated antibody during the indicated time. Cell lysates were analyzed by immunoblotting for Cish, PLC-γ1 and Zap-70 (Loading control). Numbers below the band indicate PLCγ1 expression quantification. (C) Quantification of PLC-γ1 expression from 3 experiments. Non-stimulated conditions represent 100% of PLC-γ1 expression. Bars show mean + SEM out of 3 independent experiments. Statistical significance was determined by two-tailed Student’s t test. *P ≤ 0.05. (NS = Non-stimulated).
