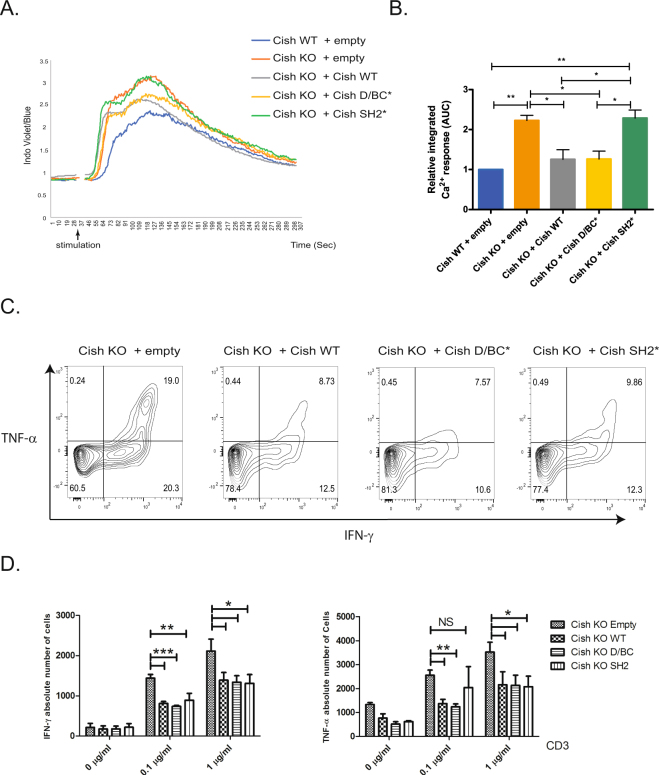
Figure 3.
(A) Representative Ca2+ flux as assessed by fluorometric evaluation after αCD3 stimulation of indicated transduced CD8+ T cells. Kinetic of the ratio indo-blue to indo-violet over time shown and assessed by flow cytometry. (B) Calcium responses were integrated and quantified relative to Cish WT+ empty vector. Error bars represent SD from the mean (n = 3). (C) To evaluate cells positive for intracellular expression of TNF-α or IFN-γ, indicated transduced CD8+ T cells were re-stimulated with anti-CD3 coated antibody (at indicated concentration) and soluble CD28 (2 μg/ml) in presence of Golgi stop for 6 hrs. Cells were then labeled for surface Thy1.1 and intracellular TNF-α or IFN-γ. The flow cytometry analysis of Thy1.1+ T cell populations is shown. (D) Absolute cell numbers of Thy1.1+ T cells positive for intracellular TNF-α or IFN-γ. Bars show mean + SEM out of at least 4 independent experiments. Statistical significance was determined by two-tailed Student’s t test. *P ≤ 0.05, **P ≤ 0.01, ***P ≤ 0.001. (NS = Non-stimulated).

