Fig. 3.
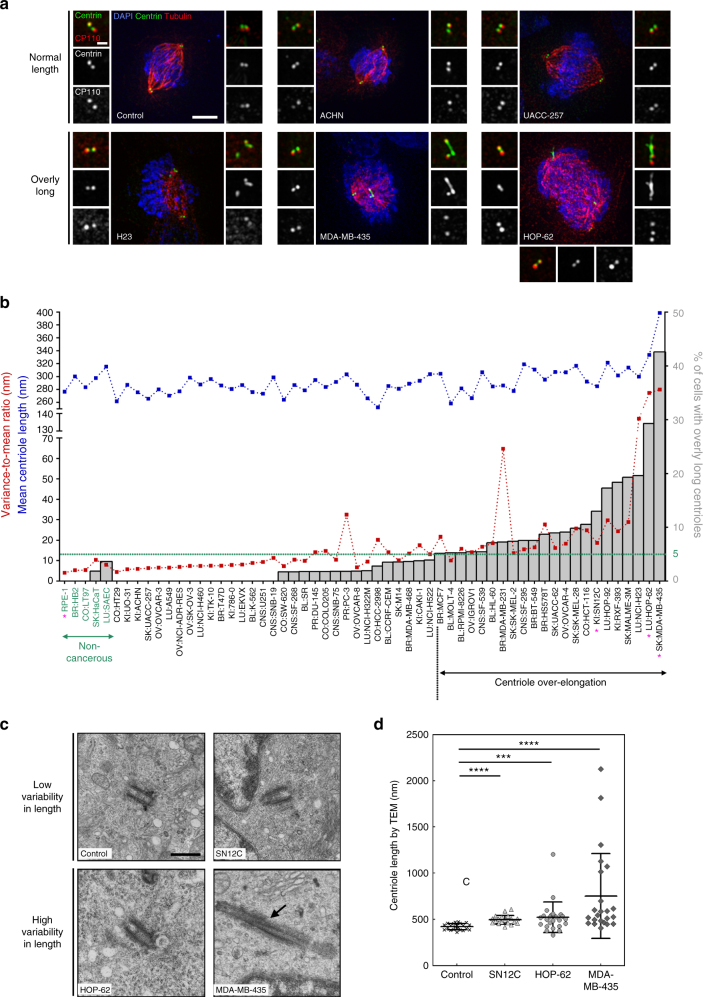
Increase and variability in centriole length are recurrent in cancer cell lines. a Immunofluorescence images of cell lines without (upper panel) and with (lower panel), centriole length deregulation. Cells were stained with DAPI (blue), α-tubulin (red), centrin (green) and CP110 (red-insets) antibodies. Scale bar 5 µm, insets 1 µm. b Output of the secondary screening for centriole length in the NCI-60. To validate the primary screening, the top 50% of over-elongation, and a subset of the less-defective ones, were processed in the secondary screening. The results of the secondary screening are depicted in the bar graph (cell lines are ranked according to their percentage of mitotic cells containing at least one overly long centriole). The mean centriole length (blue) and the variance-to-mean ratio (VMR-red), a normalised measure of the dispersion of the distribution, are depicted for each cell line. The cut-off for centriole over-elongation (in green) was set to 5% which corresponds to the average percentage (1%) of cells with centriole over-elongation in the 5 non-cancerous cell lines plus 2 s.d. (2%). 22 cell lines display significant centriole over-elongation. Centriole length was scored in 3D using centrin staining. From 207 to 388 centrioles were measured per cell line. The magenta asterisks label the cell lines that were selected for analysis by TEM. c TEM images of longitudinal sections of normal-length centrioles (around 500 nm) in the control (RPE-1) and SN12C cell lines, and of overly long centrioles in HOP-62 and MDA-MB-435 cell lines (740 and 1800 nm, respectively). Note the presence of a crack (arrow) in the overly long centriole of MDA-MB-435 cell. Each TEM picture represents an individual cell. Scale bar 500 nm. d Quantification of centriole length, using the Image J software, from TEM images of longitudinal sections of different centrioles for the control (#22, median = 427 nm, VMR = 2.7), SN12C (#20, median = 486 nm, VMR = 4.5), HOP-62 (#25, median = 502 nm, VMR = 51.9) and MDA-MB-435 (#23, median = 546 nm, VMR = 280.3) cell lines. The bar represents the mean ± s.d. ***represents p < 0.001 and ****p < 0.0001 (Mann–Whitney statistical test)

