Fig. 5.
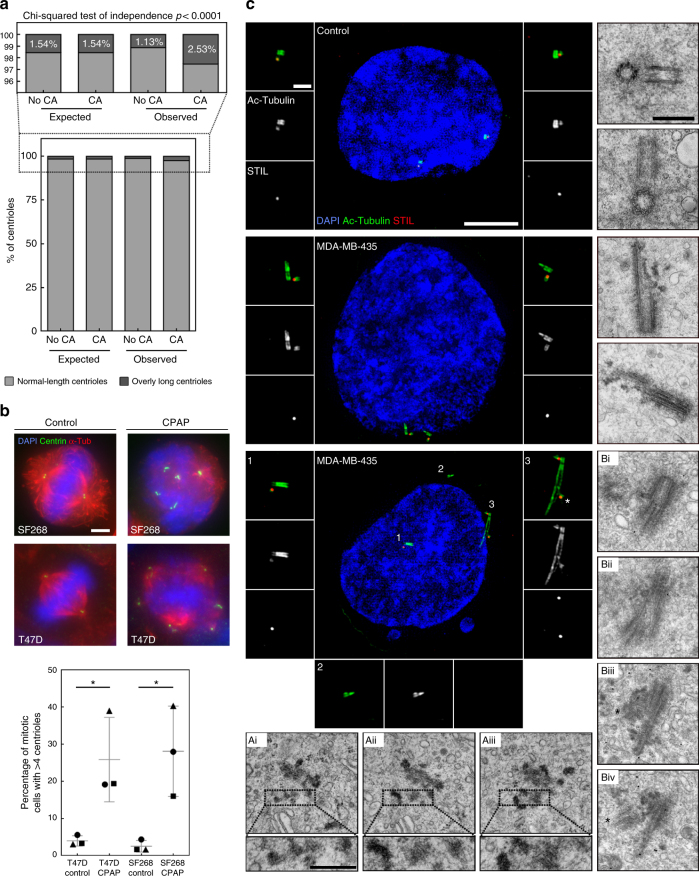
Centriole over-elongation drives centriole amplification in cancer cells via ectopic procentriole formation and centriole fragmentation. a Centriole elongation and amplification are not independent. Higher proportion of overly long centrioles (>500 nm) in cells with centriole amplification (CA), (p < 0.0001, Pearson’s Chi-squared test), compared with the expected proportions under the null hypothesis of independence. The expected and observed percentages of overly long centrioles in cells with no CA and CA are shown, together with a detailed view above, given the low frequency of overly long centrioles. b Induced centriole elongation triggers centriole amplification in cancer cell lines. CPAP was transiently overexpressed for 96 h in two cell lines from the NCI-60 panel, T47D and SF268, which do not normally display centriole over-elongation. Cells were stained with DAPI (blue), alpha-tubulin (a marker of MTs) and centrin (used as a readout for centriole number) antibodies (Scale bar 5 µm). 3 independent experiments performed (depicted with squares, triangles and circles). 80–140 cells were counted per condition and per experiment. The bars represent the means ± s.d. *Represents a p < 0.05 (one-tailed unpaired t test with Welch’s correction). c Centriole fragmentation and ectopic centriole formation in cancer cells with overly long centrioles. Examples of structured Illumination Microscopy (SIM) and TEM pictures showing normal-length centrioles in the control cell line (upper panel), overly long centrioles with defective structures (middle panel), centriolar fragments (lower panel, inset 2 for SIM and insets of Ai, ii, iii for TEM) and ectopic procentrioles along the overly long centrioles (lower panel, labelled by asterisks in inset 3 for SIM and Biii and iv for TEM) in the MDA-MB-435 cell line. For SIM, cells were stained with DAPI (blue), acetylated tubulin (green) and STIL (red) antibodies, and were subjected to a 2 h cold treatment, prior to fixation, to depolymerise the cytoplasmic MTs. For TEM, each picture represents an individual cell except for Ai, ii, iii and Bi, ii, iii and iv, where the pictures are serial sections of the same cell. Scale bar: 5 µm (SIM) or 500 nm (TEM). Insets: 1 µm (SIM) or 250 nm (TEM)

