Fig. 6.
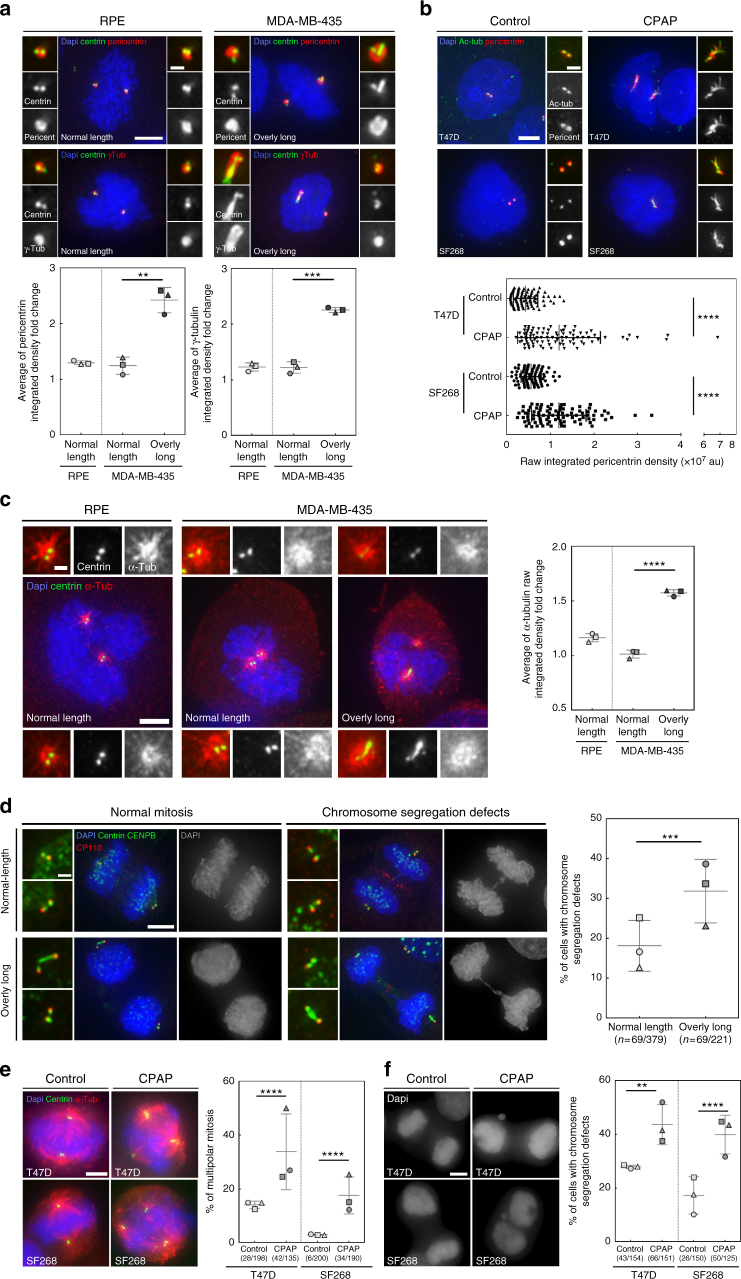
Centriole over-elongation leads to the formation of over-active centrosomes. a, b Overly long centrioles recruit more pericentriolar material than normal-length centrioles. a RPE-1 (control, only normal-length centrioles) and MDA-MB-435 (with normal-length and overly long centrioles) cells were stained with DAPI (blue), centrin (green), and γ-tubulin or pericentrin, (PCM components, red) antibodies (for details see Supplementary Fig. 11a and methods). 3 independent experiments performed (squares, triangles, circles). A total of 37–62 centrosomes quantified per condition and per experiment. One-tailed unpaired t test with Welch’s correction. b Induced centriole elongation triggers enhanced PCM recruitment. CPAP was overexpressed for 48 h in two NCI-60 cell lines, T47D and SF268, which do not display overly long centrioles. Cells were stained with DAPI (blue), pericentrin (red) and acetylated tubulin (green) antibodies. Compilation of three experiments (around 30 centrosomes accounted per condition and per experiment). Mann–Whitney test. c Overly long centrioles nucleate more MTs than normal-length centrioles. Microtubule regrowth assay in RPE-1 and MDA-MB-435 cell line. Cells were stained with DAPI (blue), α-tubulin (red) and centrin (green) antibodies (see Supplementary Fig. 11d and methods). Three independent experiments performed (squares, triangles, circles). A total of 30–82 centrosomes accounted per condition and per experiment. One-tailed unpaired t test with Welch’s correction. d Chromosome segregation defects (see Supplementary Fig. 12a, b) are increased in mitotic cells with overly long centrioles. MDA-MB-435 cells were stained with DAPI (blue), CENPB (centromere, green), centrin (green) and CP110 (red, CP110 antibody sometimes labels the midbody) antibodies. (200 cells counted per experiment, n = 3 squares, triangles, circles). z score test. e, f Induced centriole elongation enhances multipolar mitosis formation and chromosome segregation defects (for details see Supplementary Fig. 12). CPAP was transiently overexpressed for 96 h in T47D and SF268 cell lines. Cells were stained with DAPI (blue), α-tubulin (red) and centrin (green) antibodies. Three independent experiments performed (squares, triangles, circles). Between 30–87 mitosis for e and 38–55 for f accounted per condition and per experiment. z score test, one-tailed. For all images: scale bar: 5 µm, insets: 1 µm (except for b, insets: 2 µm). For all graphs, the bars represent the means ± s.d. For all tests, **p ≤ 0.01 and ***p ≤ 0.001 and ****p ≤ 0.0001

