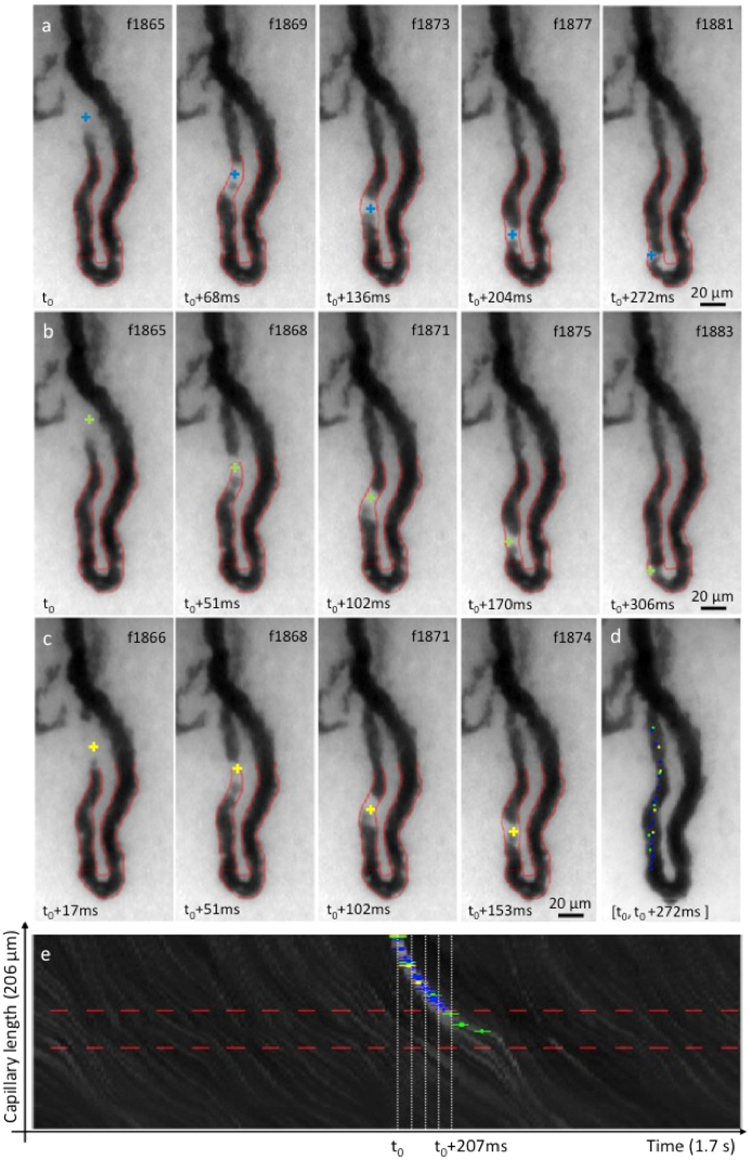
Figure 5.
Blind event rating. Three raters independently labeled one same event they observed in one of the 106 capillaries of the study. (a–c) Capillary-video frames (indexed top right) with cross-shaped event marks from rater 1 (blue), 2 (green) and 3 (yellow). (d) Aggregated positions of all event marks from all three raters. (e) ST map displaying the recorded brightness levels along the segmented capillary length (vertical axis) as a function of time (horizontal axis) for a 1.7-second interval around the event of interest. A bright trajectory created by the passage of the event is clearly identified in the center of the ST map. Blue, green, and yellow crosses correspond to the ST coordinates where each rater labeled the event.

