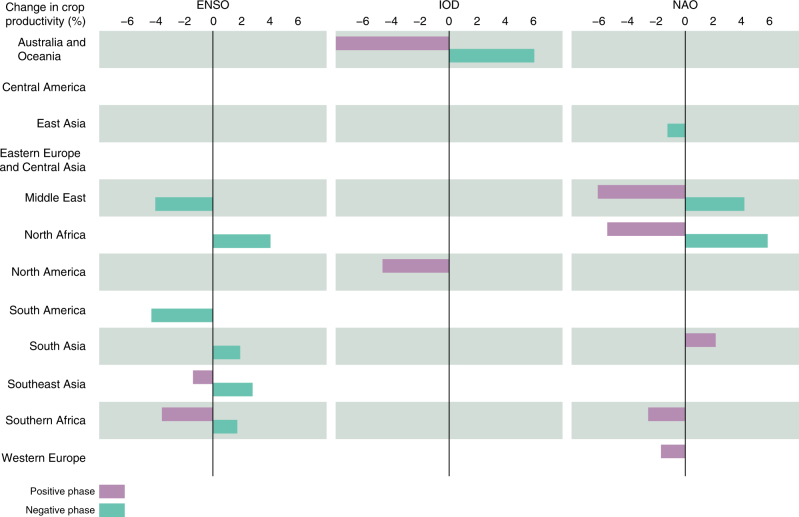
Fig. 2.
Crop productivity changes during strong oscillation phases at the regional scale. The years with negative (positive) oscillation phases were determined by inspecting whether the yearly value of the oscillation index is smaller (larger) than the 25th (75th) percentile of the yearly index values over the whole study period. The analysis was conducted by first aggregating crop productivity data to the regional scale and then assessing the changes (see Methods section). Only significant changes are indicated, as computed by bootstrapping (n = 10,000, α = 0.1). See tabulated results in Supplementary Table 1

