Figure 3.

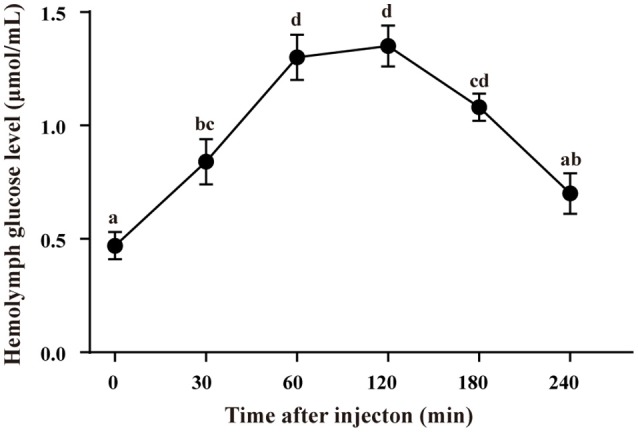
Time course of melatonin-induced hyperglycemia in intact crabs, E. sinensis. The results are shown as the means ± SE (n = 10). The different lowercase letters indicate significant differences between the groups (p < 0.05).

Time course of melatonin-induced hyperglycemia in intact crabs, E. sinensis. The results are shown as the means ± SE (n = 10). The different lowercase letters indicate significant differences between the groups (p < 0.05).