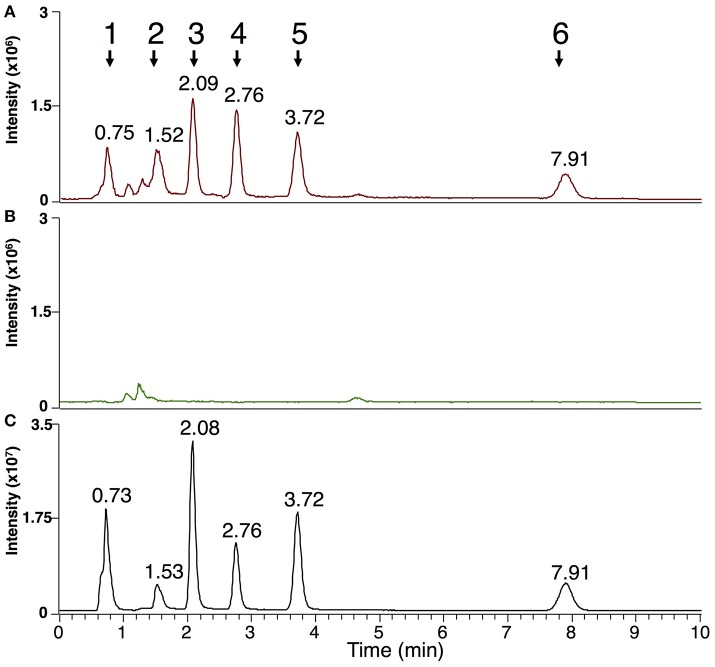
Figure 5.
Markers of P. viticola in downy mildew-infected grapevine leaves before sporulation. Analysis of MeOH/CHCl3 extracts presenting the sum of the EIC for m/z of the characterized lipids of P. viticola (±2 ppm): 303.2316 + 305.2474 + 377.2683 + 379.2839 + 492.4773 + 520.5084 + 548.5399 + 576.5713 + 661.4825 + 665.5134 + 945.6964. (A) Typical pattern obtained from downy mildew-infected leaves (Muscat Ottonel) 4 days post infection; (B) control leaves; (C) sporangia of P. viticola. For easier comparison, infected (A) and control leaves (B) are presented at the same intensity scale (3.106 arbitrary units). Peaks corresponding to lipids of P. viticola are numbered from 1 to 6 and the corresponding retention times are indicated. Peak 1: AA, EPA, AG, EPG; peak 2: DAG, DEPG, Cer(d16:1/16:0); peak 3: Cer(d16:1/18:0); peak 4: Cer(d16:1/20:0); peak 5: Cer(d16:1/22:0); peak 6: TEPG.

