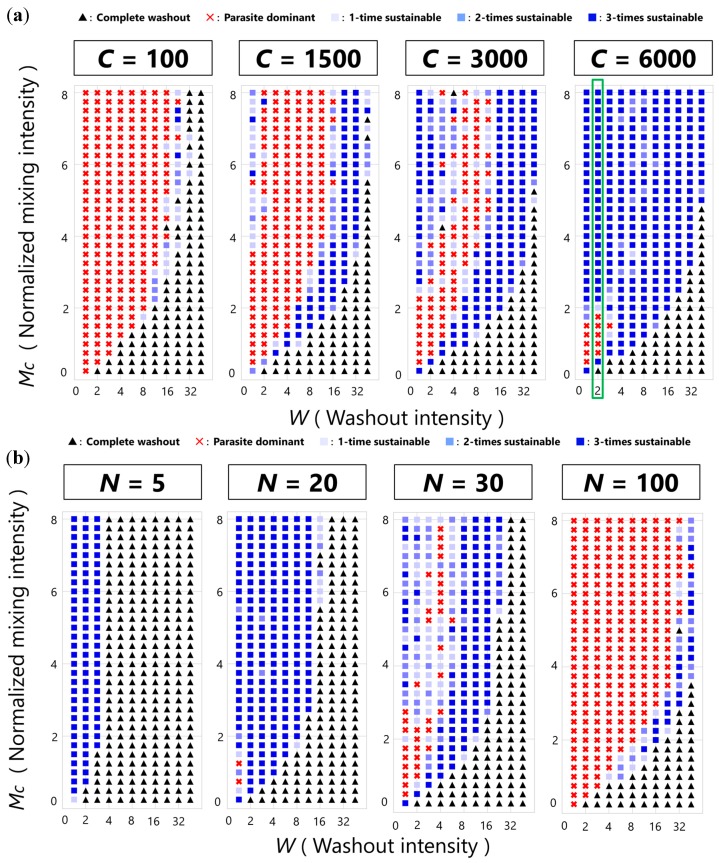
Figure 4.
Sustainability phase diagrams of the CHPR system. The symbols represent the complete washout phase (black triangles), the parasite dominant phase (red crosses), and the sustainable phase (blue squares). The strength of blue represents the extent of sustainability. (a) C = variable, N = 60. The area enclosed with the green square will be analyzed in Figure 5. (b) C = 1000, N = variable.

