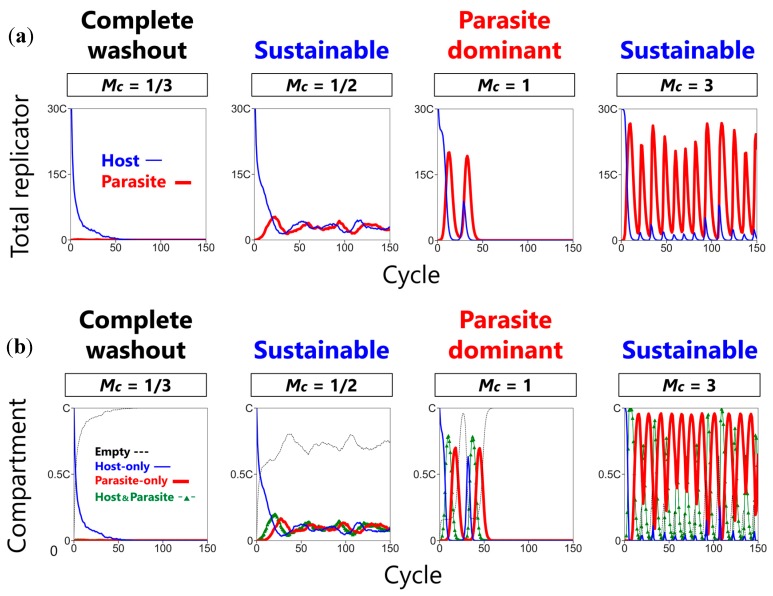
Figure 5.
The effect of the mixing intensity on the population dynamics of the CHPR system (C = 6000, W = 2, N = 60). Mc denotes the normalized mixing intensity M/C. (a) Time courses of the total number of the hosts (blue) and the parasites (red). (b) Time course of the number of compartments with different contents: empty compartments containing only nutrients (black dashed), host-only compartments (blue), parasite-only compartments (red thick), and host–parasite compartments (green with triangles). The number of the replicators and the compartments were recorded after the mixing process in each cycle (the upper-left stage in Figure 1).

