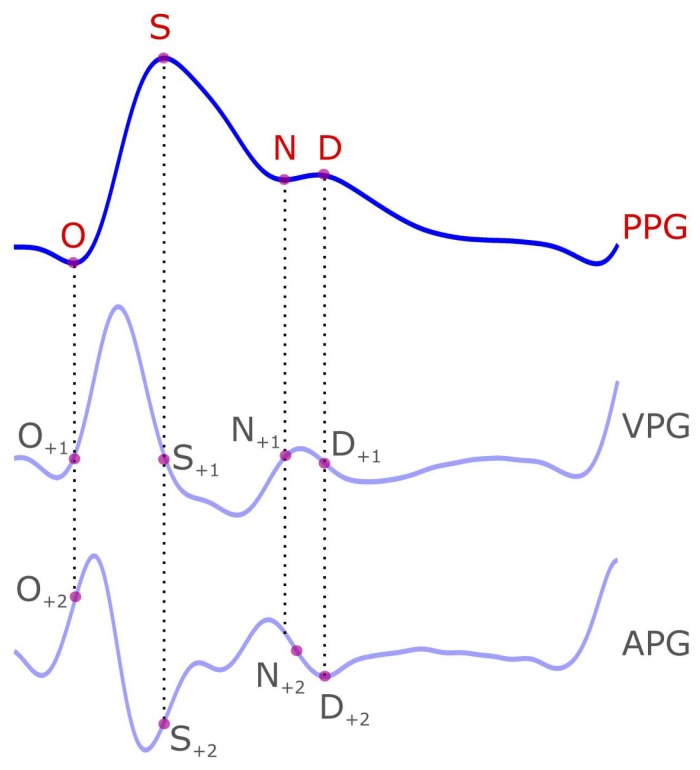
Figure 1.
Demonstration of the photoplethysmogram (PPG) signal and its four waveforms (O(nset), S(ystolic), N(otch), and D(iastolic)). The four PPG waveforms are mapped on the velocity photoplethysmogram (VPG) and the acceleration photoplethysmogram (APG) signals. The subscript of +1 indicates the location of the PPG waveform on the first derivative of the PPG signal (i.e., VPG) while the +2 subscript indicates the location of the PPG waveform on the second derivative of the VPG signal (i.e., APG).

