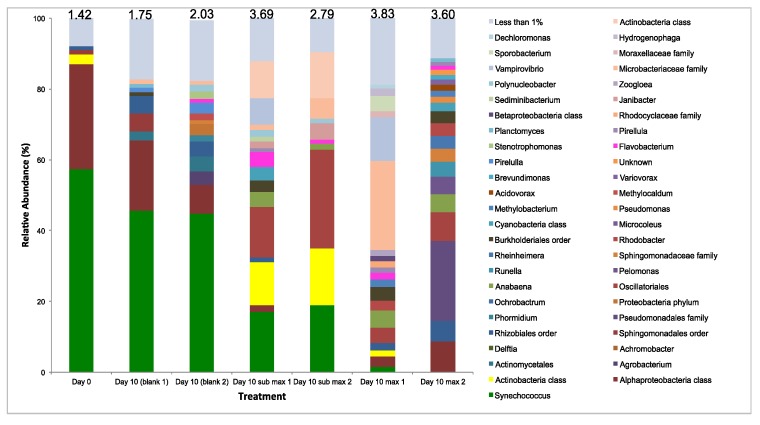
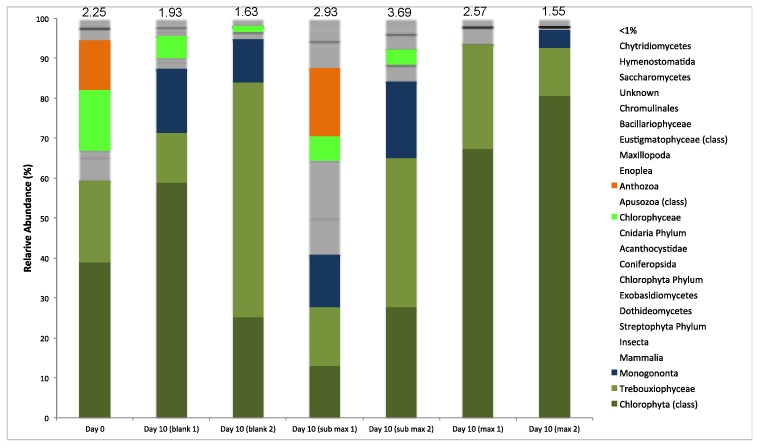
Figure 4.
Relative gene abundance (%) of microorganisms identified within WRP sample, control (no harvesting), sub-maximum harvesting, and maximum harvesting (in biological replicates). The 16S rDNA bacterial abundance is shown at a genus level except when indicated (top) and 18S rDNA eukaryotic abundance is shown at a class level except when indicated (bottom). Algae (eukaryotic microalgae and prokaryotic cyanobacteria) are shown in shades of green. The Shannon diversity indices based on OTUs are shown at the top of each column.


