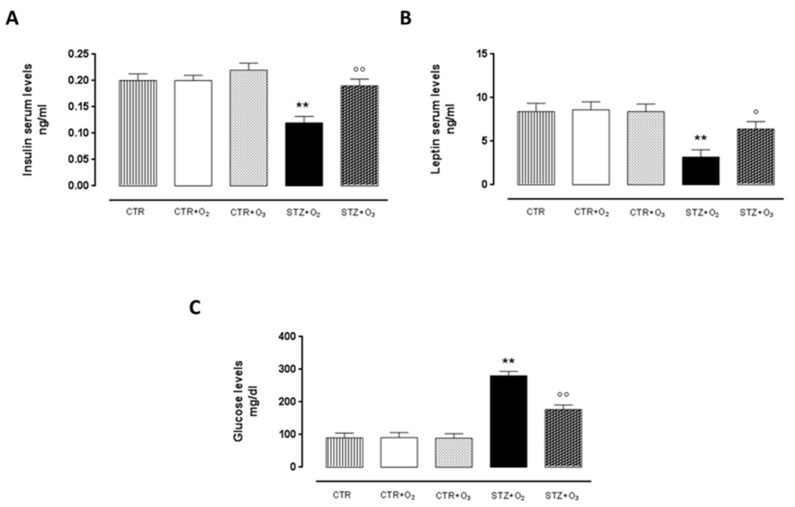
Figure 8.
Insulin, leptin and glycemia levels. ELISA test results of insulin and leptin serum levels (mg/dl ± s.e.m.), one week after STZ. Ozone treatment significantly increased insulin and leptin levels, that were low in STZ rats. Ozone treatment significantly reduced the high glycemia levels in STZ rats (p < 0.01). CTR = saline-treated rats; CTR + O2 = oxygen-treated rats; CTR + O3 = ozone-treated rats; STZ + O2 = oxygen-treated STZ rats; STZ + O3 = ozone-treated STZ rats. ** p < 0.01 vs. CTR + O2; ° p < 0.05 vs. STZ + O2; °° p < 0.01 vs. STZ + O2.

