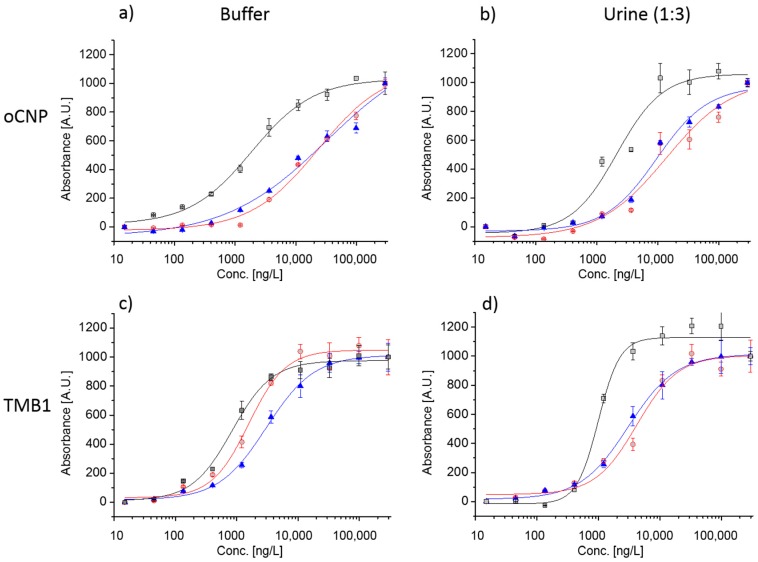
Figure 5.
Normalized colorimetric signals in (a) assay buffer with labels oCNPs (Assay Scheme III); (b) in urine (1:3) with oCNPs (c) in assay buffer using HRP (Assay Scheme VI); (d) in urine (1:3) with HRP. Calibration curves for 0 to 295 µg/L:  IL8,
IL8,  VEGF, and
  DCN; including standard deviations of three replicates. The blank signal (0 ng/L) is represented by 15 ng/L on the log scale.

