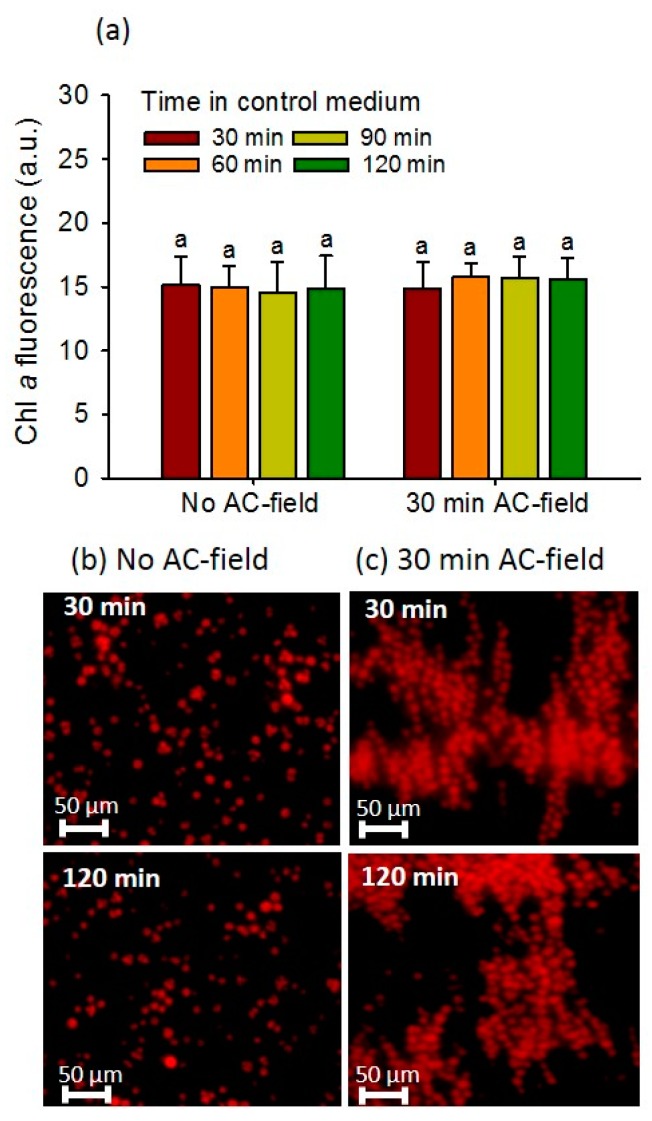
Figure 2.
Effect of the AC-field duration on chlorophyll fluorescence intensity of 2D-cellular arrays. (a) Fluorescence intensity corresponding to the mean corrected fluorescence intensity (CF) per pixel calculated from the fluorescence images obtained in DAPI channel with or without the application of AC-field. The letter ‘a’ indicates the non-statistically significant differences and were obtained by Student–Newman–Keuls test with p < 0.05. Microscopy images of autofluorescent 2D-arrays with (b) no AC-field and (c) AC-field applied for 30 min. The initial concentration of algae in suspensions was 5 × 10⁶ cells mL−1.

