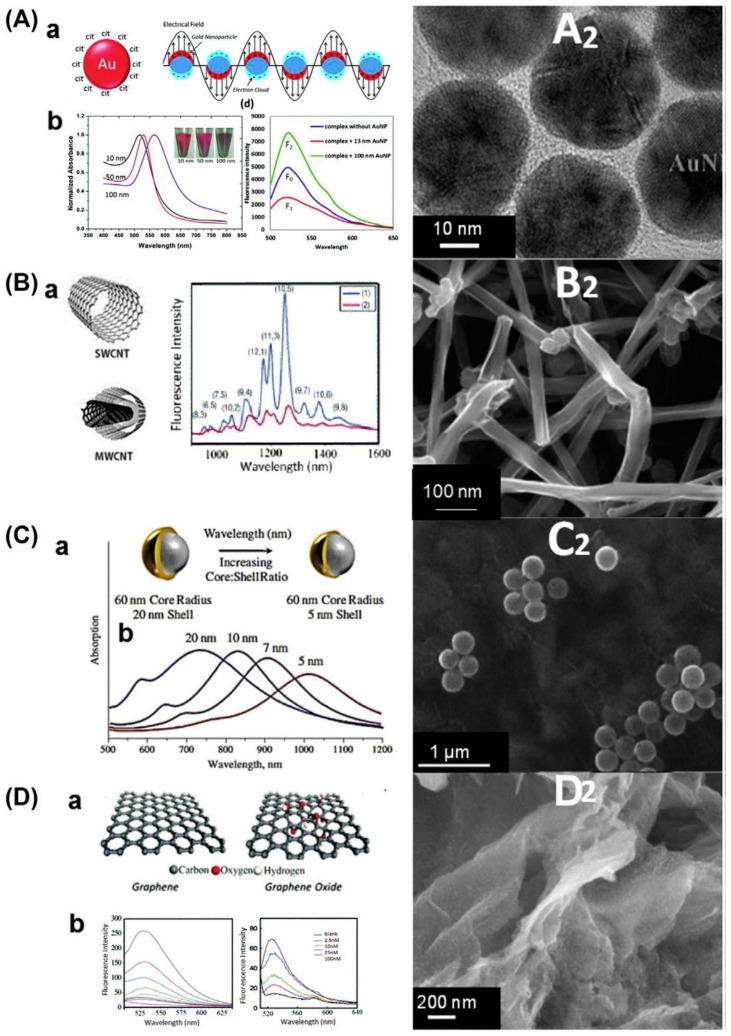
Figure 5.
(A). Ultra-violet (UV)-Vis absorption spectra corresponding to the gold nanoparticles (AuNPs) of different sizes. (A2) Transmission electron microscopy (TEM) images of synthesized AuNPs with average size of 30 nm. (B) Illustration of carbon nanotube (CNT) quenching: fluorescence spectra. (B2) Scanning electron microscopy (SEM) of multiwall CNTs. (C) Optical resonances of gold shell-silica core nanoshells as a function of their core/shell ratio. (C2) SEM images of nanoshells. (D) Illustration of graphene oxide quenching: fluorescence spectra of graphene and fluorescence spectra of graphene oxide. (D2) SEM image of graphene oxide [29].

