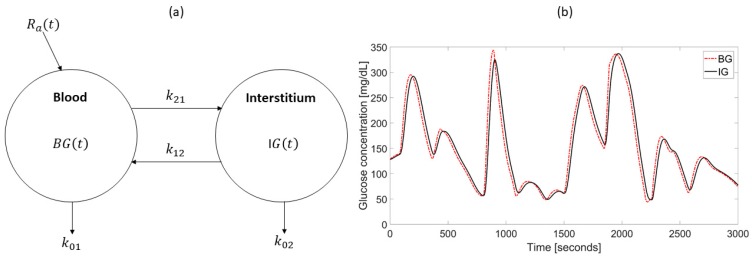
Figure 3.
(a) Two-compartment model describing the blood glucose to interstitial glucose (BG-to-IG) kinetics. is the rate of appearance; are rate constants. The time constant of the BG-to-IG system is . (b) Representative blood glucose (BG) (dashed line) and interstitial glucose (IG) (continuous line) concentration profiles simulated as described in the text assuming τ = 11 min.

