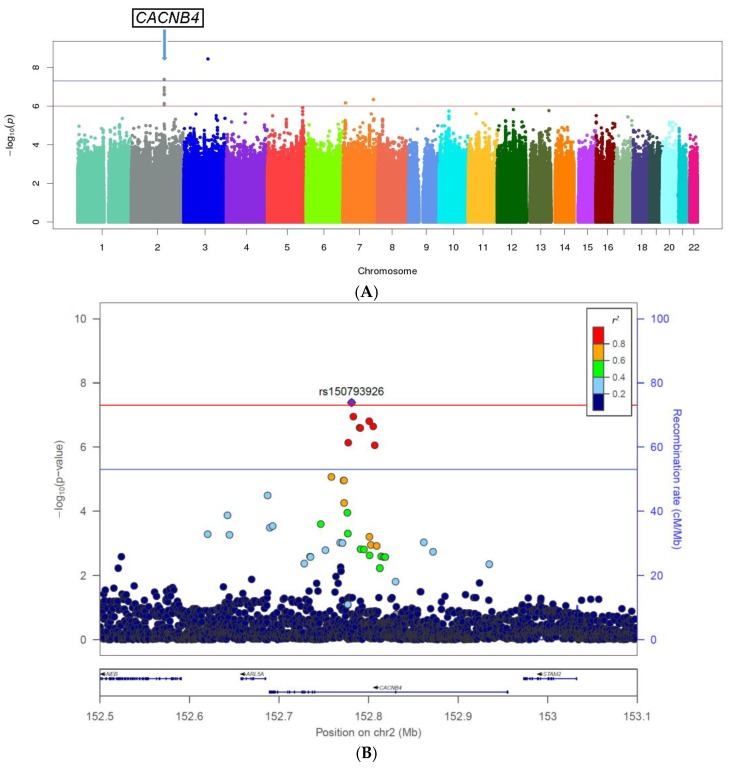
Figure 1.
(A) Manhattan plots of the genome-wide association results based on imputed data. The x-axis shows the chromosome number, while y-axis shows the −log (p). A post genome-wide association study (GWAS) filter was applied including imputation quality measure “info” >0.3, Hardy–Weinberg equilibrium (HWE) p > 1.0 × 10⁻⁶, minor allele frequencies (MAFs) >1%; (B) Regional association plot with linkage disequilibrium (LD) structure for the novel CACNB4 loci. Genomic coordinates are shown on the x-axis, and –log (p) is shown on the y-axis to the left. The index genetic variant is shown in purple. The r2 values of the remaining genetic variants with the index variant are color-coded as indicated by the color bar to the upper right. The genes in this region are indicated at the bottom.

