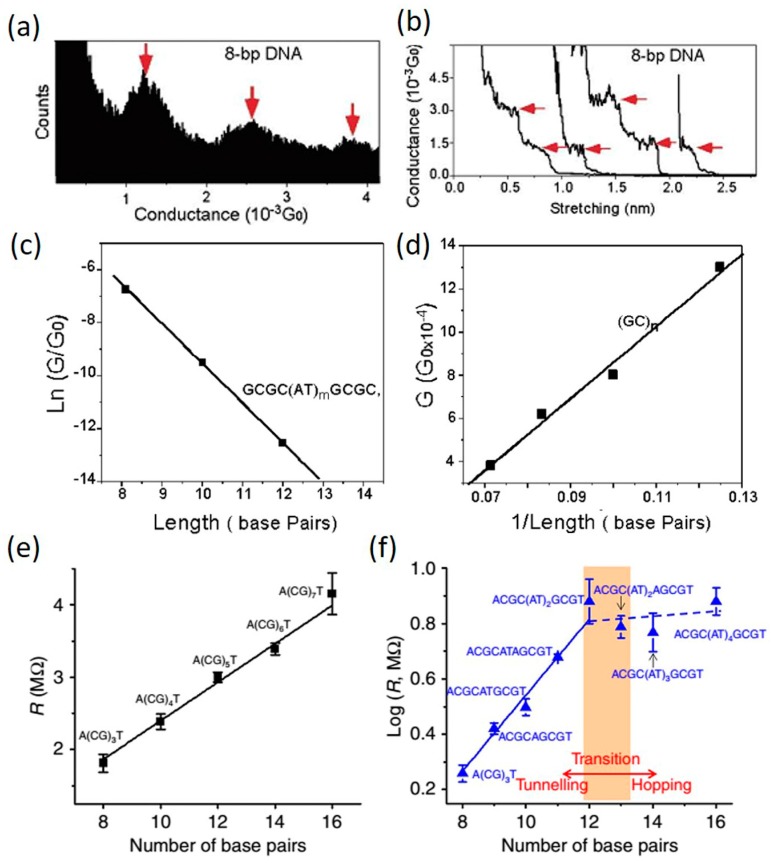
Figure 7.
Sequence and length dependent conductance (G) of single DNA molecules. Panel (a,b) show the example conductance histogram and conductance vs. distance traces, respectively; (c) ln(G/G0) vs. molecular length plot for DNA with ACGC(AT)mGCGT sequences; (d) G vs. 1/length plot for DNA with (GC)n sequences; (e) Resistance of A(CG)nT DNA as a function of number of base pairs; (f) Log R vs. number of base pair plot for DNA with ACGC(AT)mGCGT/ACGC(AT)mAGCGT sequences. (a–d) are reprinted with permission from ref. [47]. Copyright (2004) American Chemical Society. (e–f) are reprinted with permission from ref. [77]. Copyright (2016) Nature Publishing Group.

