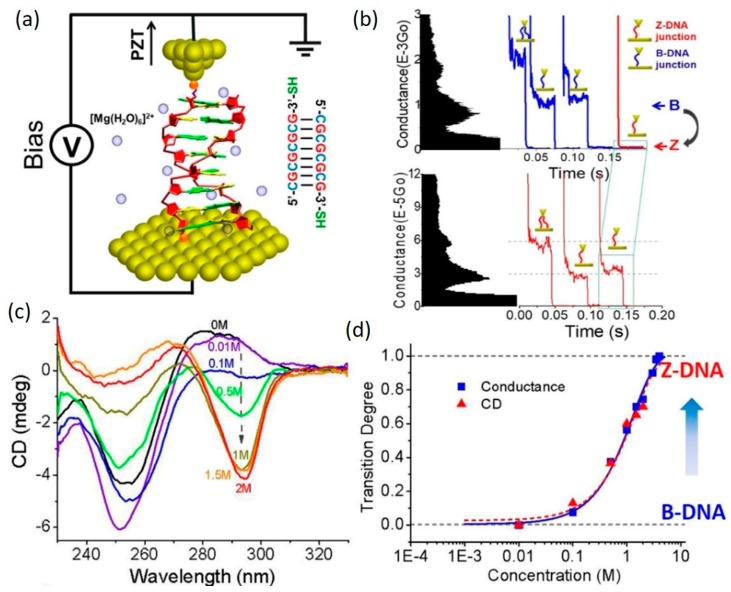
Figure 9.
Conductance measurements of poly(GC)4 DNA under a structural transition from B- to Z-form. (a) Schematic of STM-BJ method; (b) Example conductance histograms and traces of B-DNA (upper) and Z-DNA (lower) in 1 M MgCl2 solution; (c) CD spectra measured in 0–2 M MgCl2 solutions; (d) Transition degree vs. log MgCl2 concentration plot, showing the entire transition process monitored by conductance measurement. Reprinted with permission from ref. [79]. Copyright (2014) Royal Society of Chemistry.

