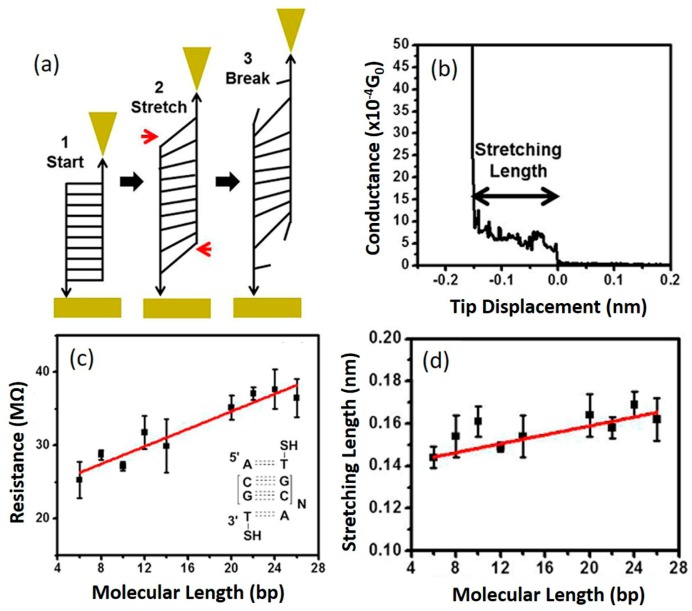
Figure 11.
Stretching effect of DNA conductance. (a) Illustration of the evolution of dsDNA duplex during stretching; (b) Example conductance trace for dsDNA sequence 5′-S(CG)2T-3′; (c) Resistance vs. molecular length plot; (d) Stretching length vs. molecular length plot. Reprinted with permission from ref. [98]. Copyright (2015) American Chemical Society.

