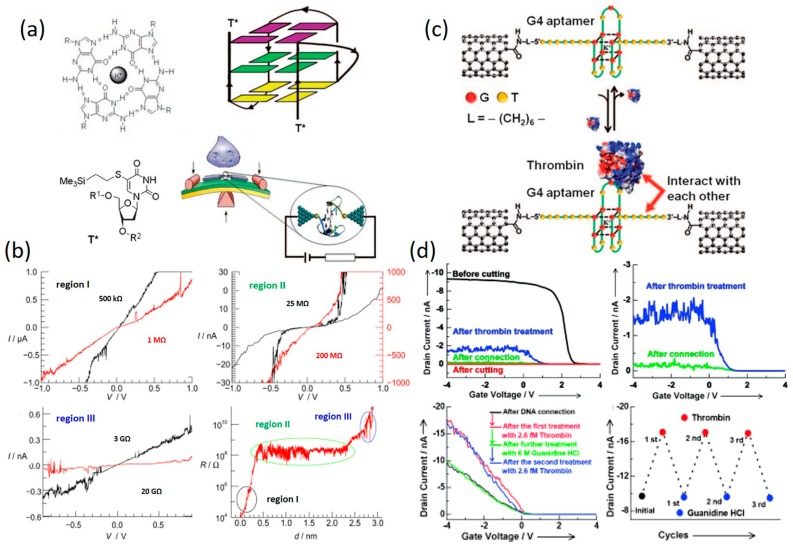
Figure 13.
(a) Schematic illustration of G4-DNA measured by MCBJ setup; (b) I–V curves measured at different at different stages of G4-DNA defolding. (a,b) are reprinted with permission from ref. [104] Copyright (2010) Wiley–VCH Verlag GmbH & Co., KGaA. (c) Schematic representation of the CNT-G4-DNA-CNT sensing setup for protein detection; (d) Current vs. gate voltage curves measured at a constant source-drain voltage of −15 mV before and after thrombin treatments, showing reversible current change at two discrete levels; (c,d) are reprinted with permission from ref. [109]. Copyright (2011) Wiley–VCH Verlag GmbH & Co. KGaA.

